33
/
AIzaSyB4mHJ5NPEv-XzF7P6NDYXjlkCWaeKw5bc
November 30, 2025
197206
Moldova
MDA
true
2
1
Broad money (current LCU)
2016,2015,2014,2013,2012,2011,2010,2009,2008,2007,2006,2005,2004,2003,2002,2001,2000,1999,1998,1997,1996,1995,1994,1993,1992
Create a timeline
Public Timelines
For education
For educational institutions
For teachers
For students
Cabinet
For educational institutions
For teachers
For students
Open cabinet
FAQ
Close
Create a timeline
Public timelines
FAQ
About & Feedback
Terms
Privacy
FAQ
Support 24/7
Cabinet
Get premium
Donate
Download
Global statistics library
→
Moldova
→
Broad money (current LCU)
This statistics in other country:
Afghanistan
Albania
Algeria
Angola
Antigua and Barbuda
Argentina
Armenia
Aruba
Australia
Azerbaijan
Bahamas, The
Bahrain
Bangladesh
Barbados
Belarus
Belize
Benin
Bhutan
Bolivia
Bosnia and Herzegovina
Botswana
Brazil
Brunei Darussalam
Bulgaria
Burkina Faso
Burundi
Cabo Verde
Cambodia
Cameroon
Canada
Central African Republic
Chad
Chile
China
Colombia
Comoros
Congo, Dem. Rep.
Congo, Rep.
Costa Rica
Cote d'Ivoire
Croatia
Czech Republic
Denmark
Djibouti
Dominica
Dominican Republic
Ecuador
Egypt, Arab Rep.
El Salvador
Equatorial Guinea
Eritrea
Estonia
Ethiopia
Euro area
Fiji
Gabon
Gambia, The
Georgia
Ghana
Grenada
Guatemala
Guinea
Guinea-Bissau
Guyana
Haiti
Honduras
Hong Kong SAR, China
Hungary
Iceland
India
Indonesia
Iran, Islamic Rep.
Iraq
Israel
Jamaica
Japan
Jordan
Kazakhstan
Kenya
Korea, Rep.
Kuwait
Kyrgyz Republic
Lao PDR
Latvia
Lebanon
Lesotho
Liberia
Libya
Lithuania
Macao SAR, China
Macedonia, FYR
Madagascar
Malawi
Malaysia
Maldives
Mali
Mauritania
Mauritius
Mexico
Micronesia, Fed. Sts.
Moldova
Mongolia
Morocco
Mozambique
Myanmar
Namibia
Nepal
New Zealand
Nicaragua
Niger
Nigeria
Norway
Oman
Pakistan
Panama
Papua New Guinea
Paraguay
Peru
Philippines
Poland
Qatar
Romania
Russian Federation
Rwanda
Samoa
Sao Tome and Principe
Saudi Arabia
Senegal
Serbia
Seychelles
Sierra Leone
Singapore
Slovak Republic
Solomon Islands
South Africa
South Sudan
Sri Lanka
St. Kitts and Nevis
St. Lucia
St. Vincent and the Grenadines
Sudan
Suriname
Swaziland
Sweden
Switzerland
Syrian Arab Republic
Tajikistan
Tanzania
Thailand
Timor-Leste
Togo
Tonga
Trinidad and Tobago
Tunisia
Turkey
Uganda
Ukraine
United Arab Emirates
United Kingdom
United States
Uruguay
Vanuatu
Venezuela, RB
Vietnam
West Bank and Gaza
Yemen, Rep.
Zambia
Zimbabwe
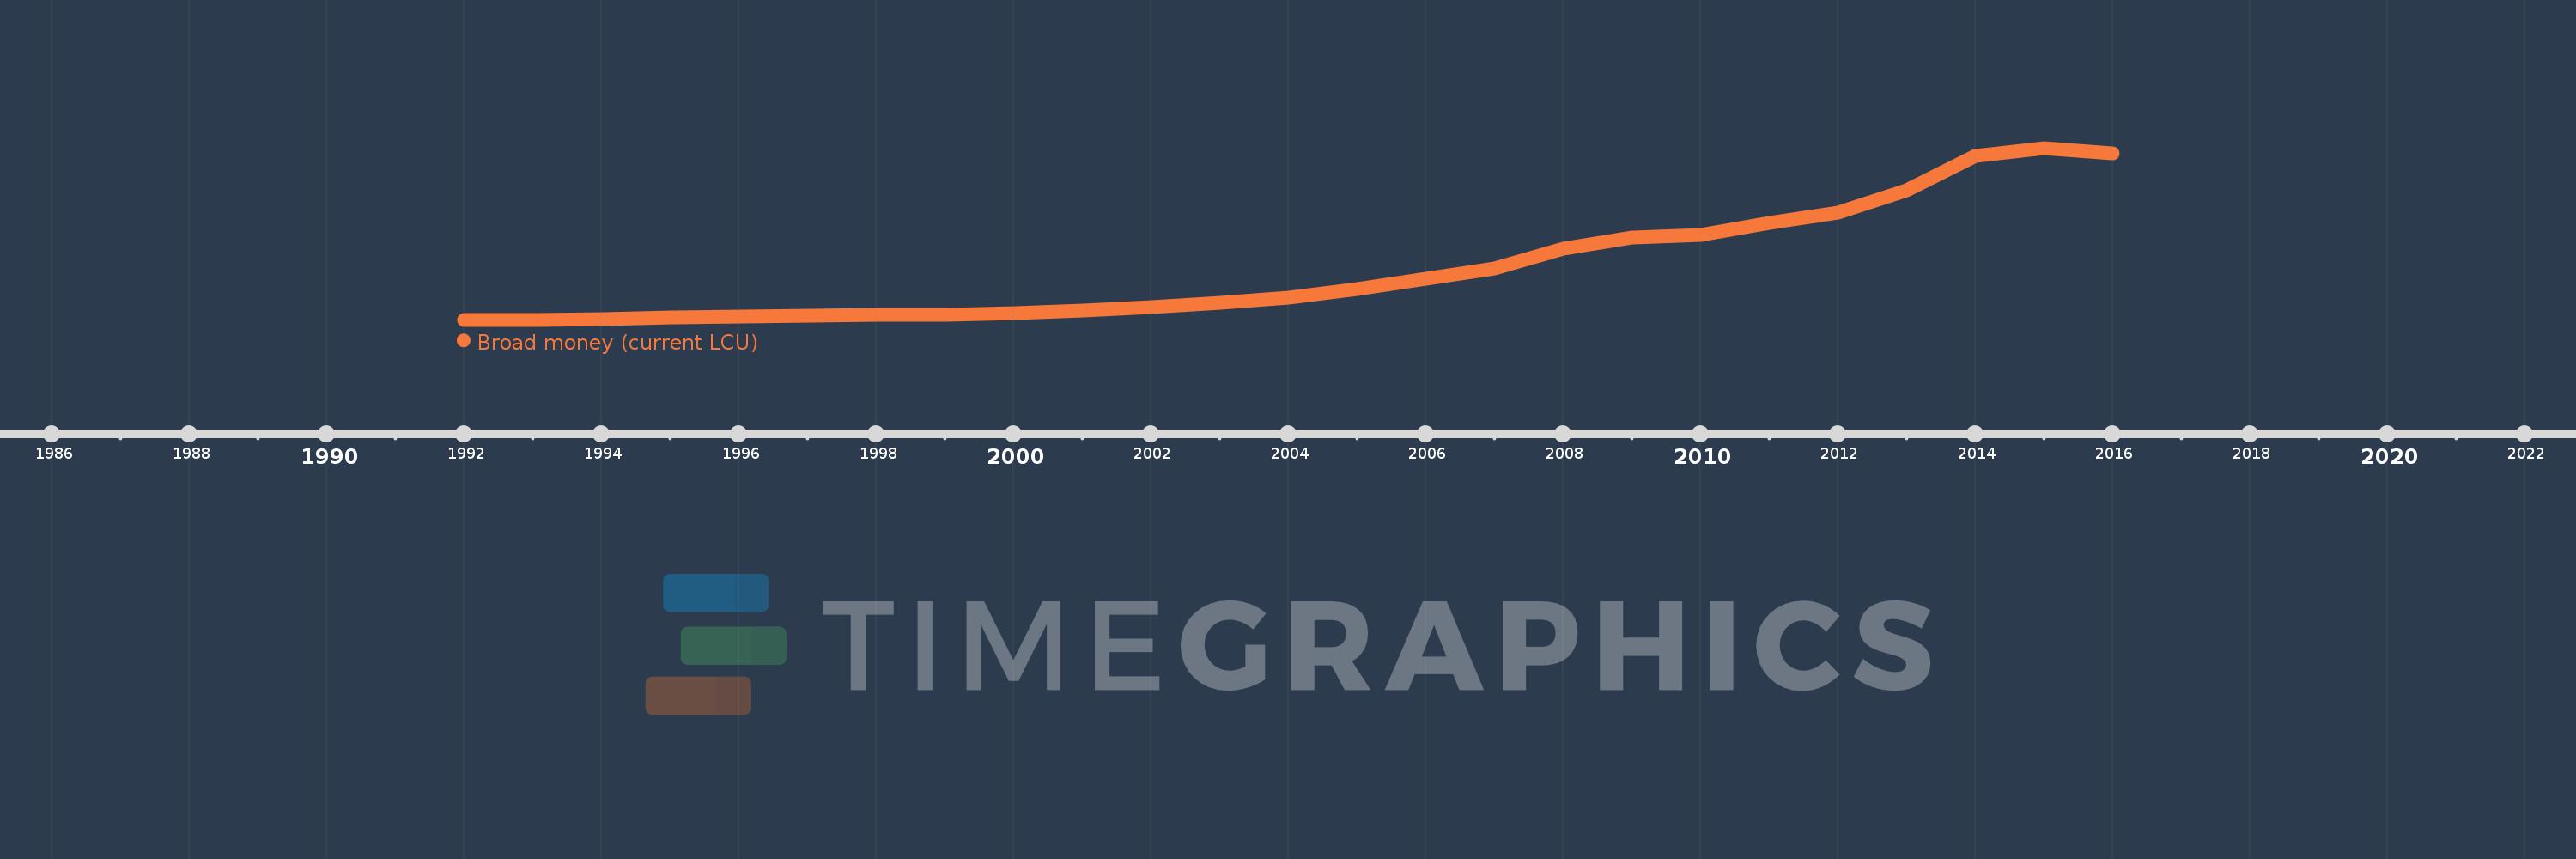
Timeline:
This timeline shows a graph from
1992
to
2016
of Moldova. No data until
1991
. Number of actual observations by date:
25
.
Source name:
World Development Indicators
Source organization:
International Monetary Fund, International Financial Statistics and data files.
Categories, topics:
Financial Sector
Last updated:
apr 23, 2017
Indicators value changes by year
Meaning:
19.719 bln
Minimum:
18.21 mln
jan 1, 1992
Maximum:
65.973 bln
jan 1, 2015
At the date of observation
Value
Absolute change
Change from the previous value
jan 1, 1992
18.21 mln
+18.21 mln
0.0%
jan 1, 1993
83.395 mln
+65.185 mln
357.96%
jan 1, 1994
349.244 mln
+265.849 mln
318.78%
jan 1, 1995
753.205 mln
+403.962 mln
115.67%
jan 1, 1996
1.245 bln
+492.01 mln
65.32%
jan 1, 1997
1.43 bln
+184.866 mln
14.85%
jan 1, 1998
1.923 bln
+492.775 mln
34.46%
jan 1, 1999
1.764 bln
-158.919 mln
-8.26%
jan 1, 2000
2.52 bln
+756.082 mln
42.86%
jan 1, 2001
3.571 bln
+1.051 bln
41.72%
jan 1, 2002
4.79 bln
+1.218 bln
34.11%
jan 1, 2003
6.538 bln
+1.748 bln
36.51%
jan 1, 2004
8.523 bln
+1.985 bln
30.36%
jan 1, 2005
11.773 bln
+3.25 bln
38.13%
jan 1, 2006
15.827 bln
+4.054 bln
34.44%
jan 1, 2007
19.558 bln
+3.731 bln
23.58%
jan 1, 2008
27.344 bln
+7.786 bln
39.81%
jan 1, 2009
31.681 bln
+4.337 bln
15.86%
jan 1, 2010
32.684 bln
+1.004 bln
3.17%
jan 1, 2011
37.137 bln
+4.452 bln
13.62%
jan 1, 2012
41.074 bln
+3.937 bln
10.6%
jan 1, 2013
49.626 bln
+8.552 bln
20.82%
jan 1, 2014
62.783 bln
+13.156 bln
26.51%
jan 1, 2015
65.973 bln
+3.19 bln
5.08%
jan 1, 2016
64.005 bln
-1.968 bln
-2.98%
Ranking of countries by current statistics by years
About & Feedback
Terms
Privacy
FAQ
Support 24/7
Cabinet
Get premium
Donate
The service accepts bank transfer (ACH, Wire) or cards (Visa, MasterCard, etc). Processed by Stripe.
Secured with SSL