33
/
AIzaSyB4mHJ5NPEv-XzF7P6NDYXjlkCWaeKw5bc
November 30, 2025
190864
Mali
MLI
true
2
1
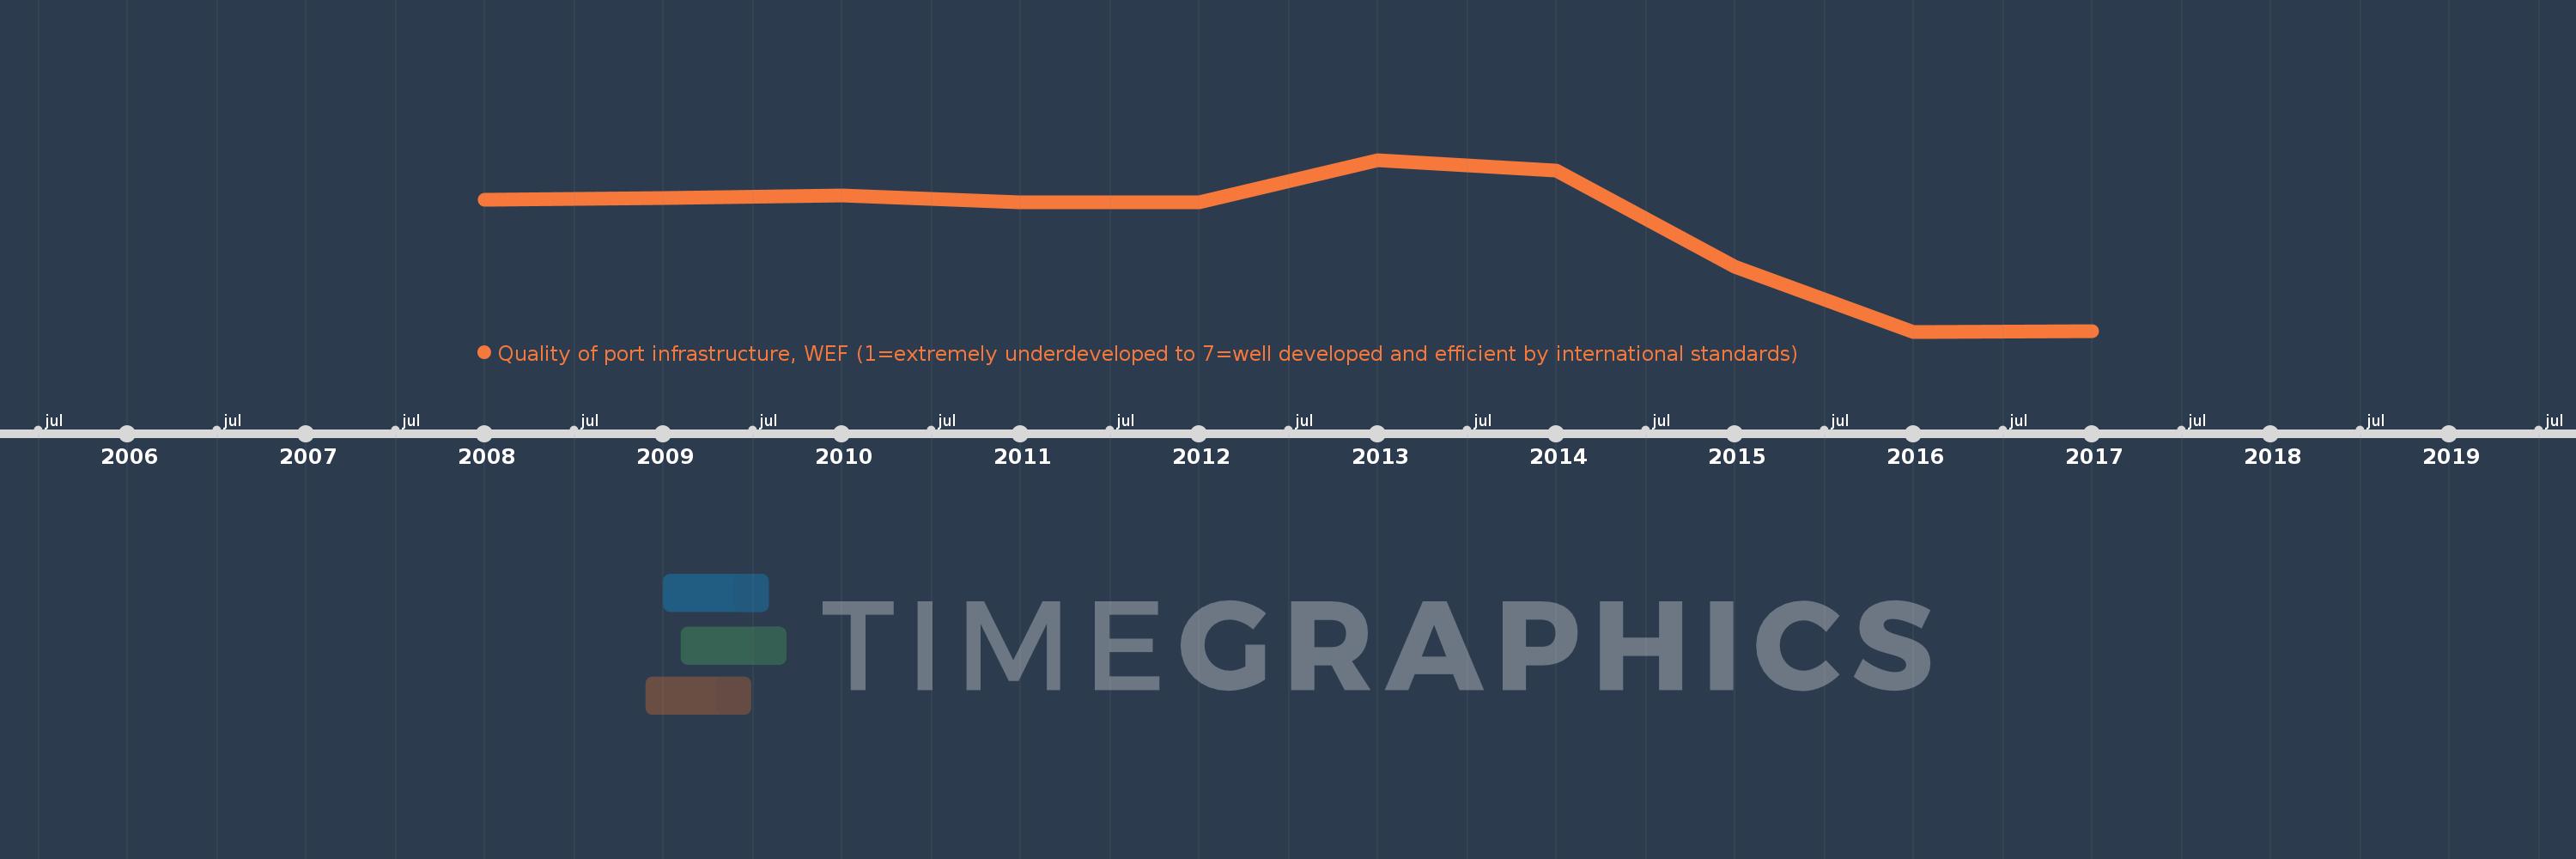
Quality of port infrastructure, WEF (1=extremely underdeveloped to 7=well developed and efficient by international standards)
2017,2016,2015,2014,2013,2012,2011,2010,2009,2008