Download This statistics in other country:
Timeline:
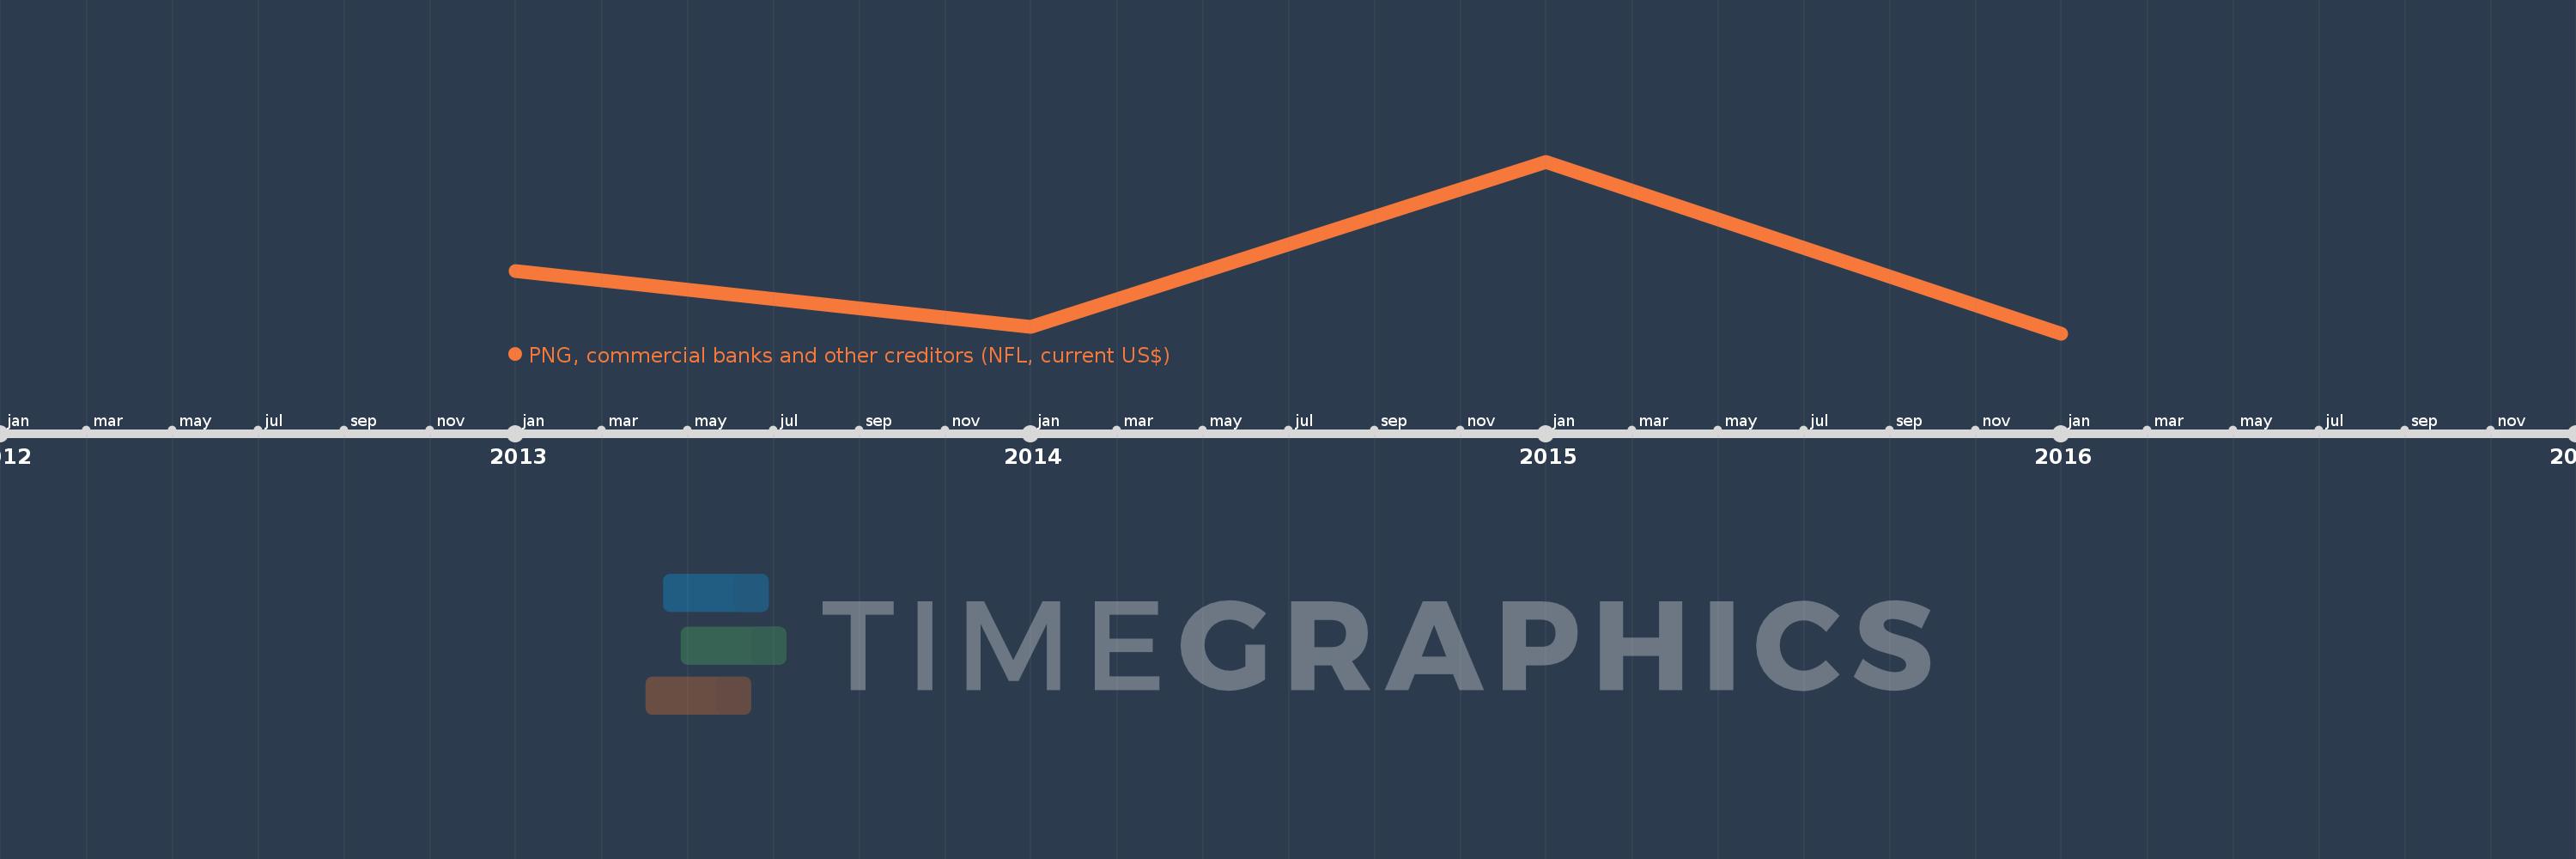
This timeline shows a graph from 2013 to 2016 of Malaysia. No data until 2012. Number of actual observations by date: 4.
Source name:
World Development Indicators
Source organization:
World Bank, International Debt Statistics.
Categories, topics:
External Debt
Last updated:
apr 23, 2017
Indicators value changes by year
Minimum:
-679.431 mln
jan 1, 2016
Maximum:
5.641 bln
jan 1, 2015
At the date of observation
Value
Absolute change
Change from the previous value
jan 1, 2013
1.596 bln
+1.596 bln
0.0%
jan 1, 2014
-452.207 mln
-2.048 bln
-128.33%
jan 1, 2015
5.641 bln
+6.093 bln
-1.35K%
jan 1, 2016
-679.431 mln
-6.32 bln
-112.05%
Ranking of countries by current statistics by years