33
/
AIzaSyB4mHJ5NPEv-XzF7P6NDYXjlkCWaeKw5bc
November 30, 2025
183201
Macao SAR, China
MAC
true
2
1
Net taxes on products (current US$)
2013,2012,2011,2010,2009,2008,2007,2006,2005,2004,2003,2002,2001,2000,1999,1998,1997,1996,1995,1994,1993,1992
Create a timeline
Public Timelines
For education
For educational institutions
For teachers
For students
Cabinet
For educational institutions
For teachers
For students
Open cabinet
FAQ
Close
Create a timeline
Public timelines
FAQ
About & Feedback
Terms
Privacy
FAQ
Support 24/7
Cabinet
Get premium
Donate
Download
Global statistics library
→
Macao SAR, China
→
Net taxes on products (current US$)
This statistics in other country:
Afghanistan
Albania
Algeria
Andorra
Antigua and Barbuda
Argentina
Armenia
Aruba
Australia
Austria
Azerbaijan
Bahamas, The
Bahrain
Bangladesh
Barbados
Belarus
Belgium
Belize
Benin
Bermuda
Bhutan
Bolivia
Bosnia and Herzegovina
Botswana
Brazil
Bulgaria
Burkina Faso
Burundi
Cabo Verde
Cambodia
Cameroon
Canada
Central African Republic
Chad
Chile
Colombia
Congo, Dem. Rep.
Costa Rica
Croatia
Cuba
Cyprus
Czech Republic
Denmark
Djibouti
Dominica
Dominican Republic
Ecuador
Egypt, Arab Rep.
El Salvador
Equatorial Guinea
Eritrea
Estonia
Ethiopia
Faroe Islands
Fiji
Finland
France
Gabon
Gambia, The
Georgia
Germany
Ghana
Greece
Grenada
Guatemala
Guinea
Guinea-Bissau
Guyana
Honduras
Hong Kong SAR, China
Hungary
India
Indonesia
Iran, Islamic Rep.
Ireland
Italy
Jamaica
Japan
Jordan
Kazakhstan
Kenya
Kiribati
Korea, Rep.
Kosovo
Kyrgyz Republic
Lao PDR
Latvia
Lebanon
Lesotho
Liberia
Liechtenstein
Lithuania
Luxembourg
Macao SAR, China
Macedonia, FYR
Madagascar
Malawi
Malaysia
Maldives
Mali
Marshall Islands
Mauritania
Mauritius
Mexico
Micronesia, Fed. Sts.
Moldova
Mongolia
Montenegro
Morocco
Mozambique
Namibia
Nepal
Netherlands
New Zealand
Nicaragua
Niger
Nigeria
Norway
Oman
Pakistan
Palau
Panama
Papua New Guinea
Paraguay
Peru
Poland
Portugal
Romania
Russian Federation
Rwanda
Sao Tome and Principe
Senegal
Serbia
Seychelles
Sierra Leone
Singapore
Slovak Republic
Slovenia
Solomon Islands
South Africa
Spain
Sri Lanka
St. Kitts and Nevis
St. Lucia
St. Vincent and the Grenadines
Sudan
Suriname
Swaziland
Sweden
Switzerland
Syrian Arab Republic
Tajikistan
Tanzania
Thailand
Timor-Leste
Tonga
Trinidad and Tobago
Tunisia
Turkey
Turkmenistan
Tuvalu
Uganda
Ukraine
United Kingdom
United States
Uruguay
Uzbekistan
Vanuatu
Venezuela, RB
Vietnam
West Bank and Gaza
Yemen, Rep.
Zambia
Zimbabwe
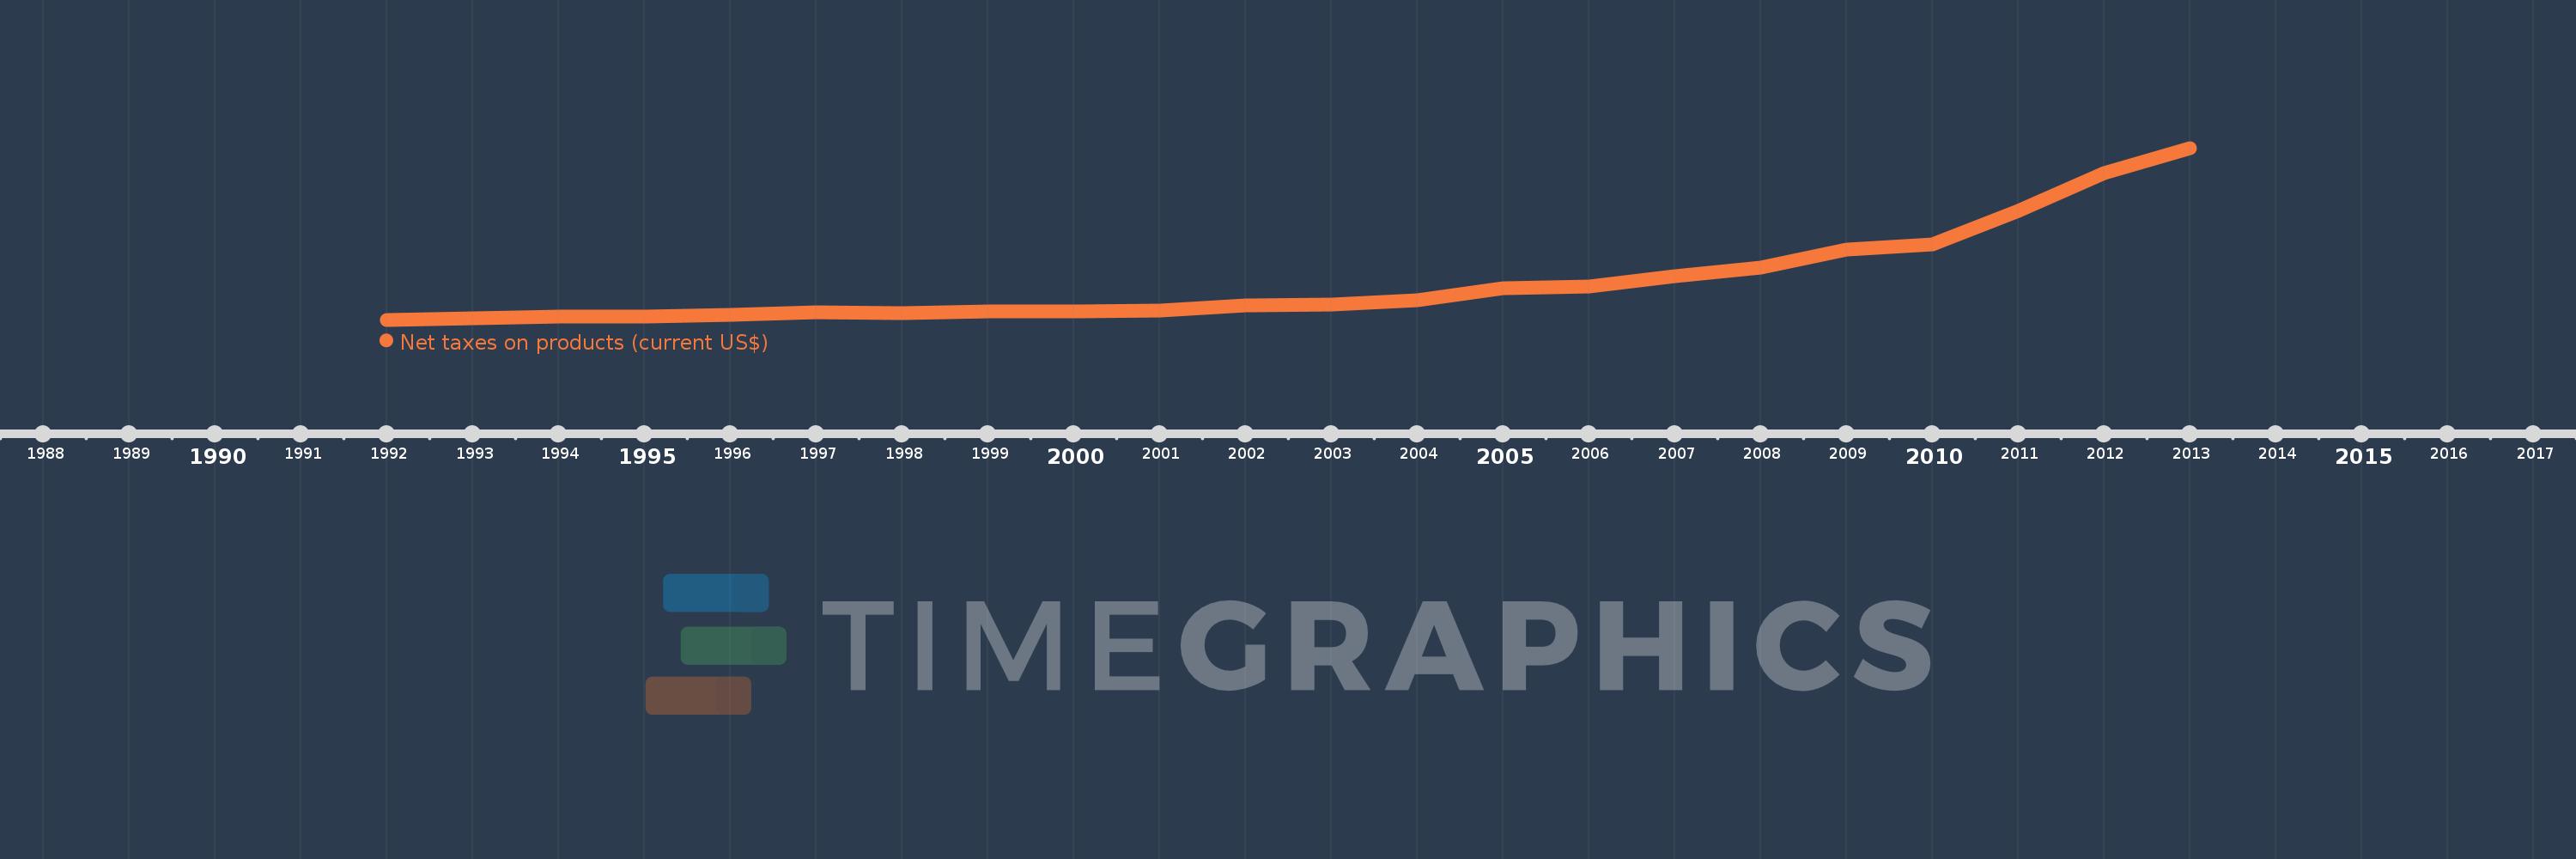
Timeline:
This timeline shows a graph from
1992
to
2013
of Macao SAR, China. No data until
1991
. Number of actual observations by date:
22
.
Source name:
World Development Indicators
Source organization:
World Bank national accounts data, and OECD National Accounts data files.
Categories, topics:
Economy & Growth
Last updated:
apr 23, 2017
Indicators value changes by year
Meaning:
3.504 bln
Minimum:
100.358 mln
jan 1, 1992
Maximum:
15.491 bln
jan 1, 2013
At the date of observation
Value
Absolute change
Change from the previous value
jan 1, 1992
100.358 mln
+100.358 mln
0.0%
jan 1, 1993
229.969 mln
+129.61 mln
129.15%
jan 1, 1994
348.085 mln
+118.116 mln
51.36%
jan 1, 1995
422.646 mln
+74.561 mln
21.42%
jan 1, 1996
531.471 mln
+108.825 mln
25.75%
jan 1, 1997
766.631 mln
+235.16 mln
44.25%
jan 1, 1998
725.227 mln
-41.403 mln
-5.4%
jan 1, 1999
866.966 mln
+141.738 mln
19.54%
jan 1, 2000
833.848 mln
-33.117 mln
-3.82%
jan 1, 2001
902.739 mln
+68.891 mln
8.26%
jan 1, 2002
1.4 bln
+497.099 mln
55.07%
jan 1, 2003
1.487 bln
+87.317 mln
6.24%
jan 1, 2004
1.864 bln
+376.687 mln
25.33%
jan 1, 2005
2.951 bln
+1.087 bln
58.32%
jan 1, 2006
3.069 bln
+118.044 mln
4.0%
jan 1, 2007
3.974 bln
+905.527 mln
29.51%
jan 1, 2008
4.797 bln
+822.203 mln
20.69%
jan 1, 2009
6.39 bln
+1.593 bln
33.22%
jan 1, 2010
6.863 bln
+472.729 mln
7.4%
jan 1, 2011
9.873 bln
+3.011 bln
43.87%
jan 1, 2012
13.212 bln
+3.339 bln
33.82%
jan 1, 2013
15.491 bln
+2.279 bln
17.25%
Ranking of countries by current statistics by years
About & Feedback
Terms
Privacy
FAQ
Support 24/7
Cabinet
Get premium
Donate
The service accepts bank transfer (ACH, Wire) or cards (Visa, MasterCard, etc). Processed by Stripe.
Secured with SSL