33
/
AIzaSyB4mHJ5NPEv-XzF7P6NDYXjlkCWaeKw5bc
November 30, 2025
179399
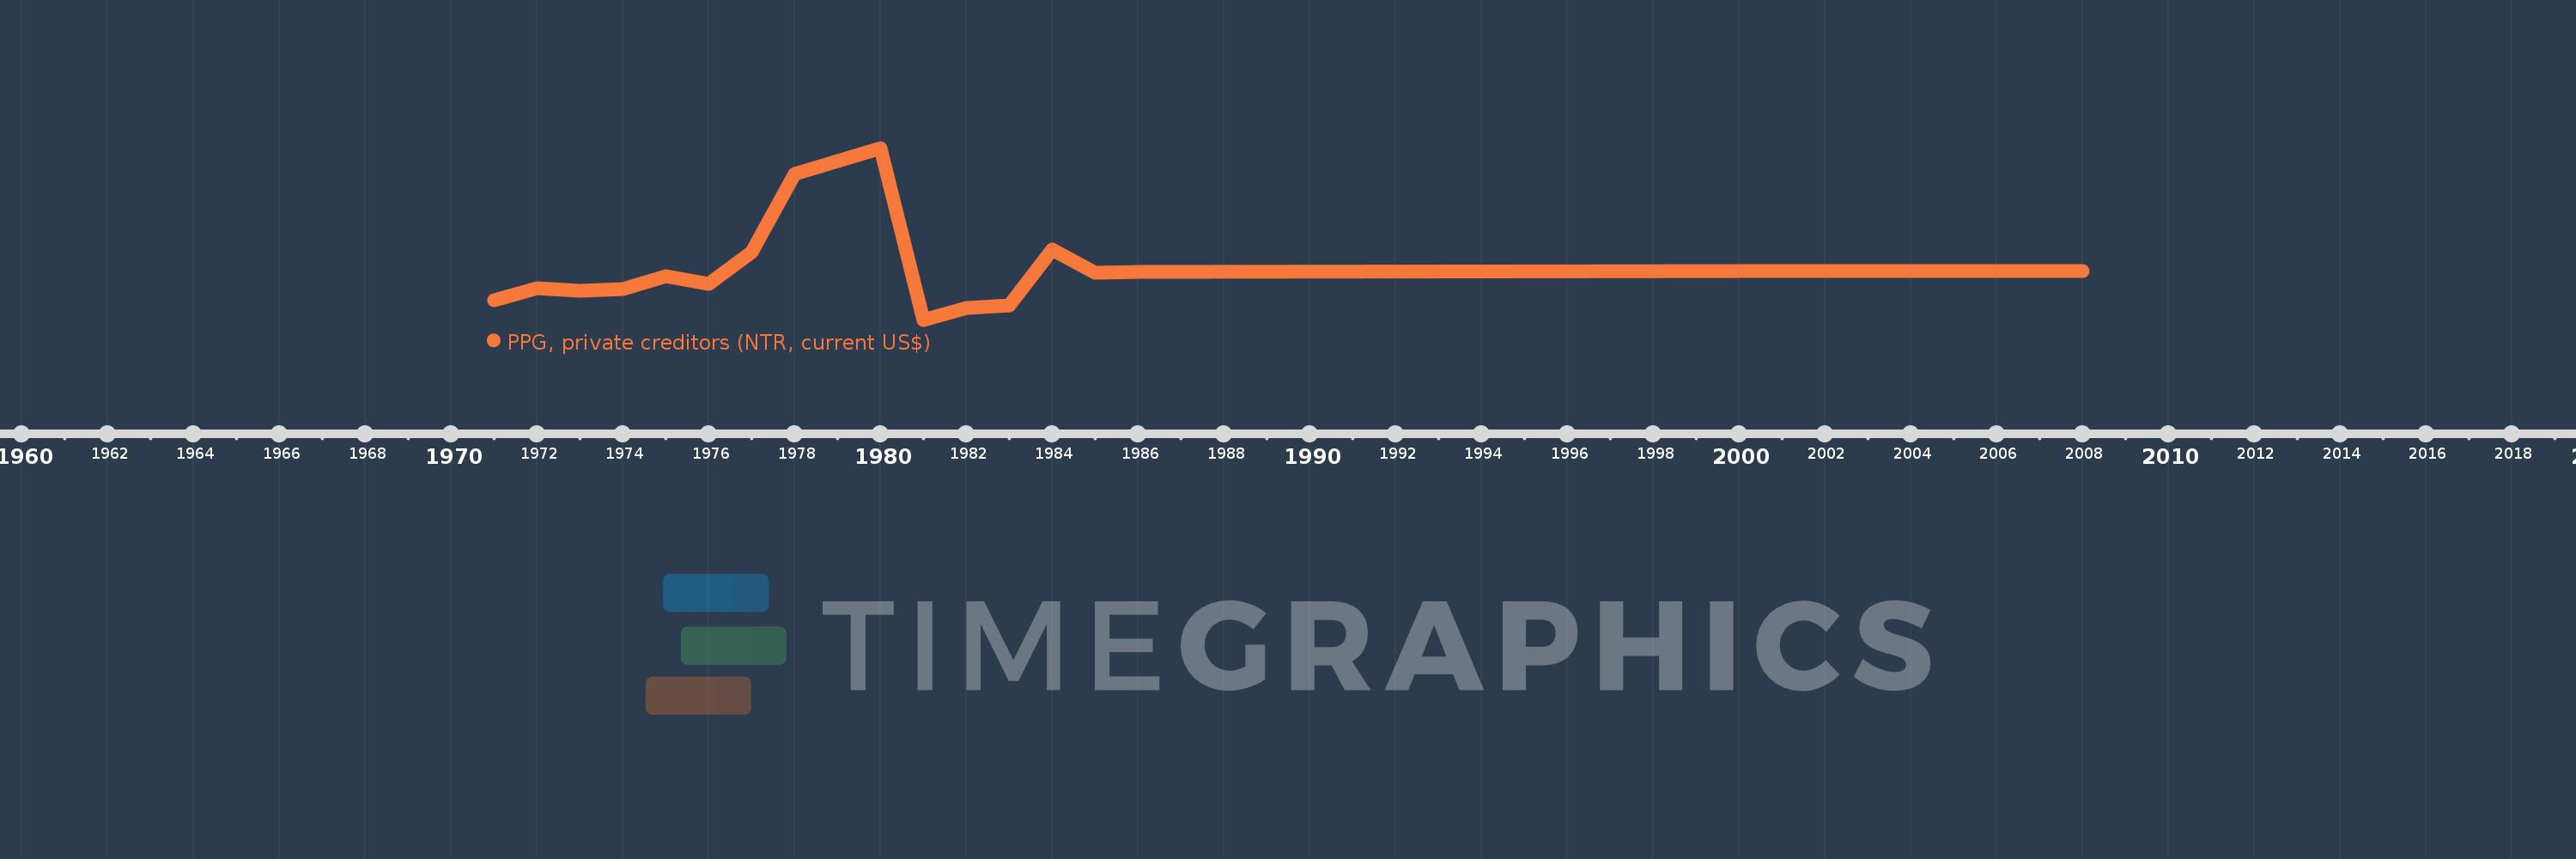
Liberia
LBR
true
2
1
PPG, private creditors (NTR, current US$)
2008,2007,2006,2005,2004,2003,2002,2001,2000,1986,1985,1984,1983,1982,1981,1980,1979,1978,1977,1976,1975,1974,1973,1972,1971