Download This statistics in other country:
Timeline:
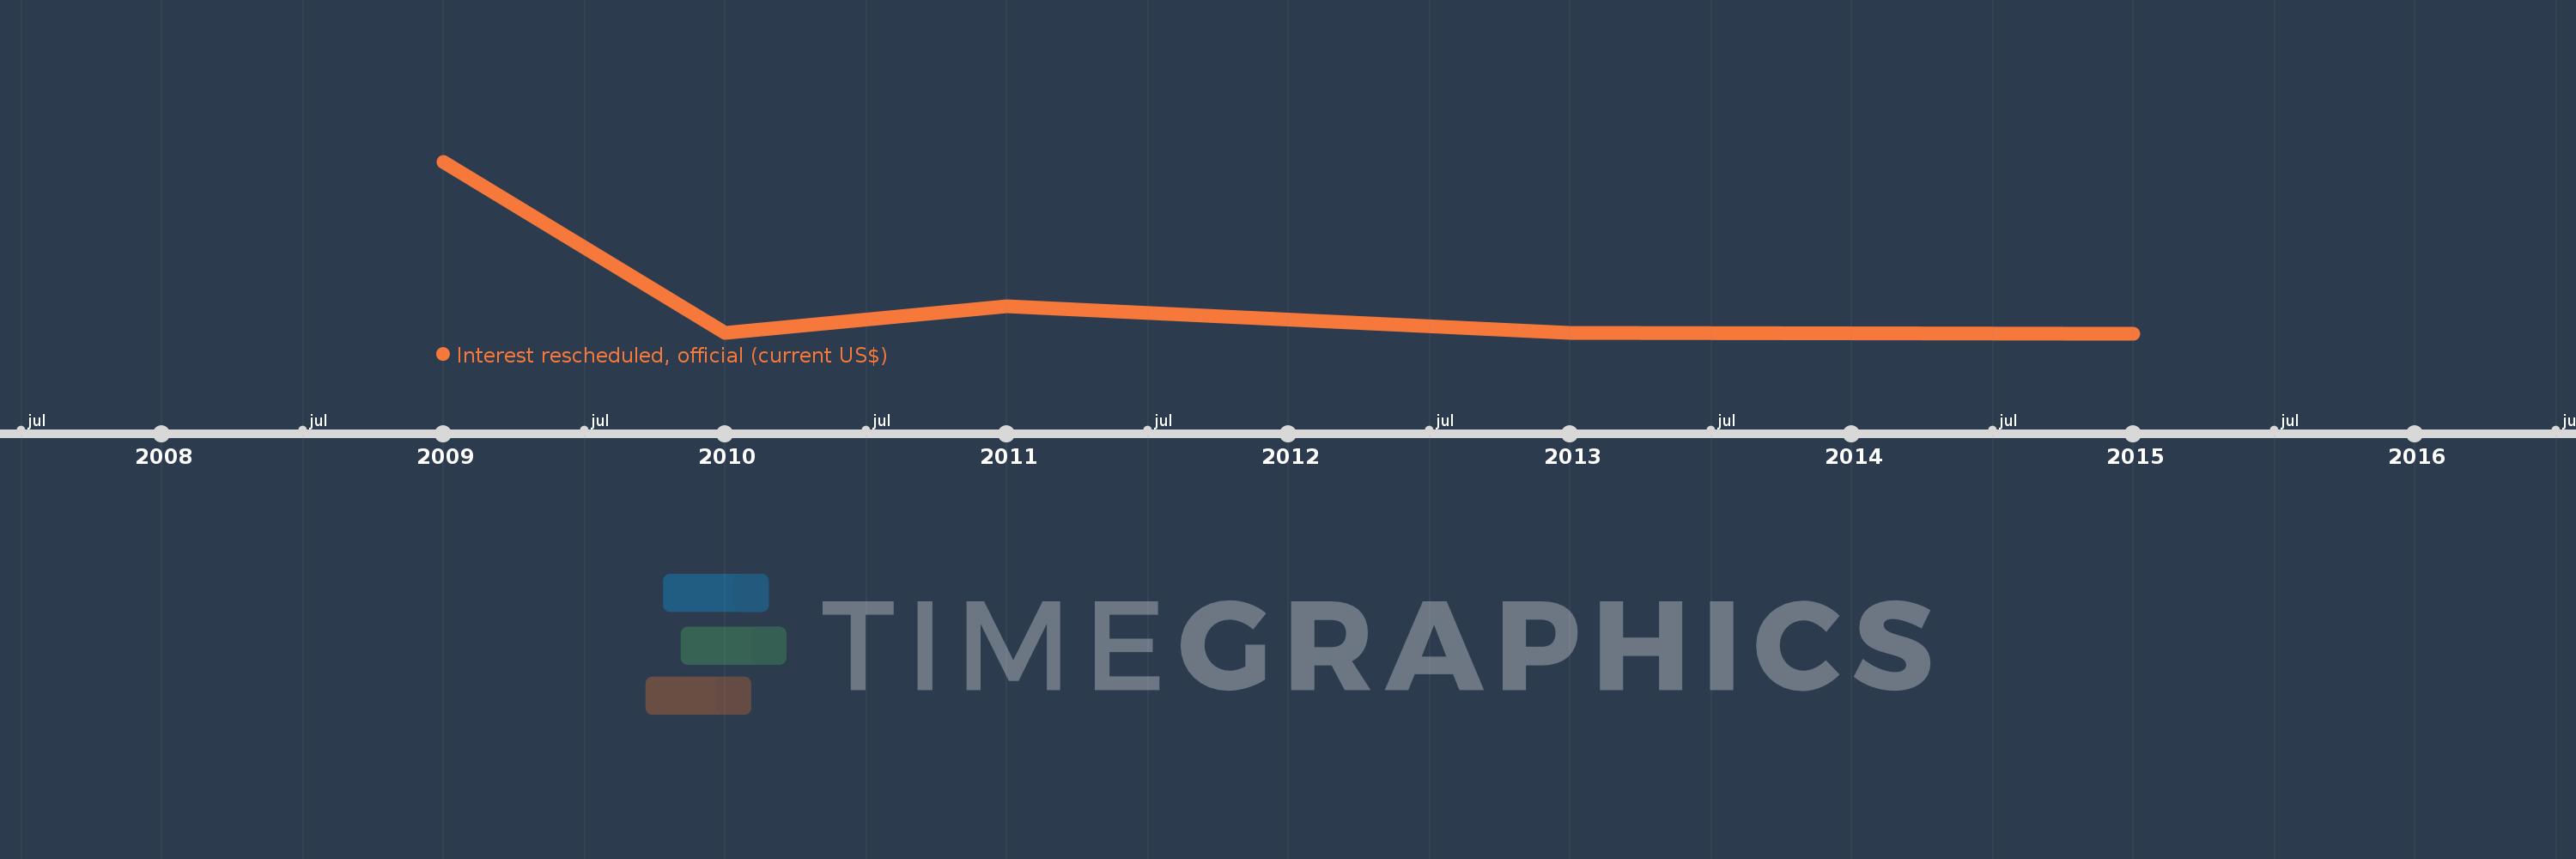
This timeline shows a graph from 2009 to 2015 of Liberia. No data until 2008. Number of actual observations by date: 5.
Source name:
World Development Indicators
Source organization:
World Bank, International Debt Statistics.
Categories, topics:
External Debt
Last updated:
apr 23, 2017
Indicators value changes by year
Maximum:
155.174 mln
jan 1, 2009
At the date of observation
Value
Absolute change
Change from the previous value
jan 1, 2009
155.174 mln
+155.174 mln
0.0%
jan 1, 2010
129.0K
-155.045 mln
-99.92%
jan 1, 2011
24.177 mln
+24.048 mln
18.64K%
jan 1, 2013
116.0K
-24.061 mln
-99.52%
jan 1, 2015
0.0
-116.0K
-100.0%
Ranking of countries by current statistics by years