33
/
AIzaSyB4mHJ5NPEv-XzF7P6NDYXjlkCWaeKw5bc
November 30, 2025
178711
Liberia
LBR
true
2
1
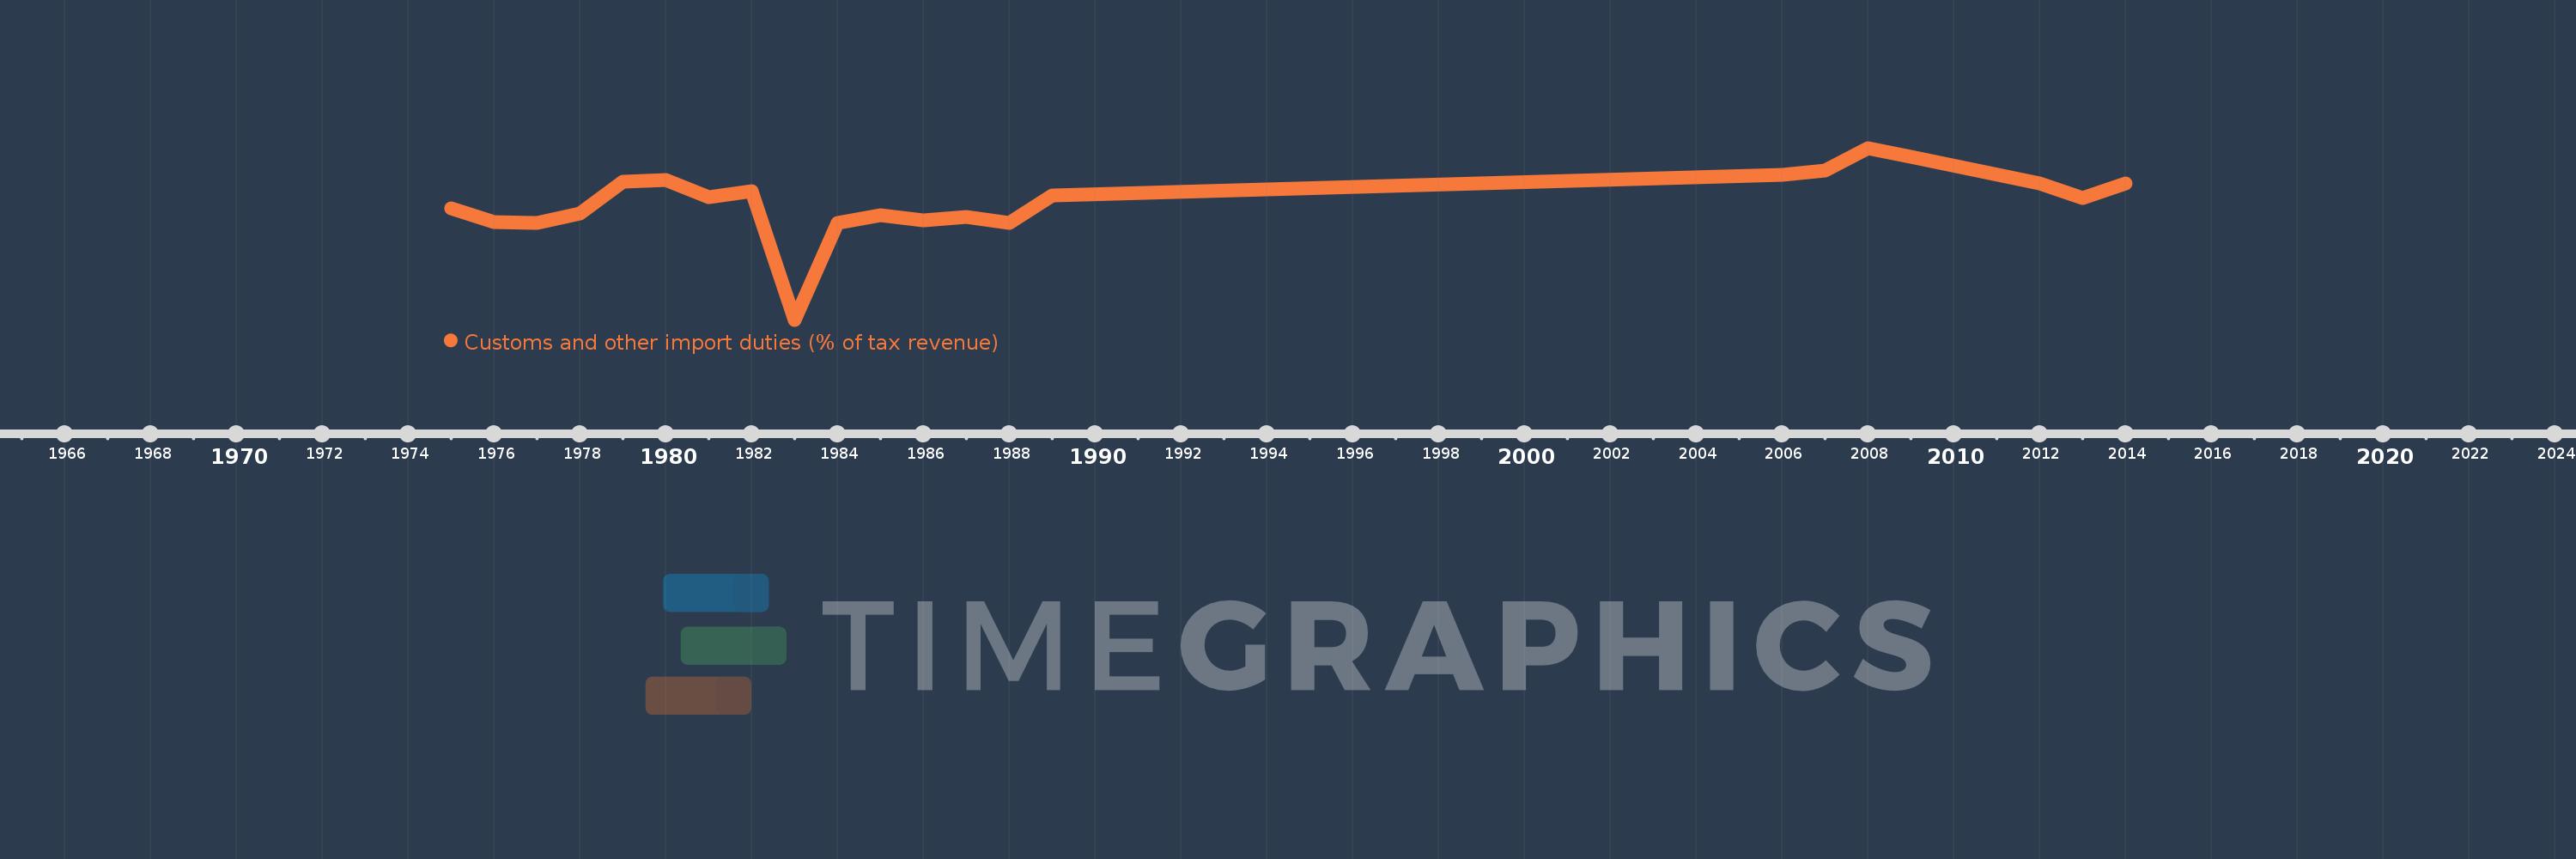
Customs and other import duties (% of tax revenue)
2014,2013,2012,2009,2008,2007,2006,1989,1988,1987,1986,1985,1984,1983,1982,1981,1980,1979,1978,1977,1976,1975