33
/
AIzaSyB4mHJ5NPEv-XzF7P6NDYXjlkCWaeKw5bc
November 30, 2025
177897
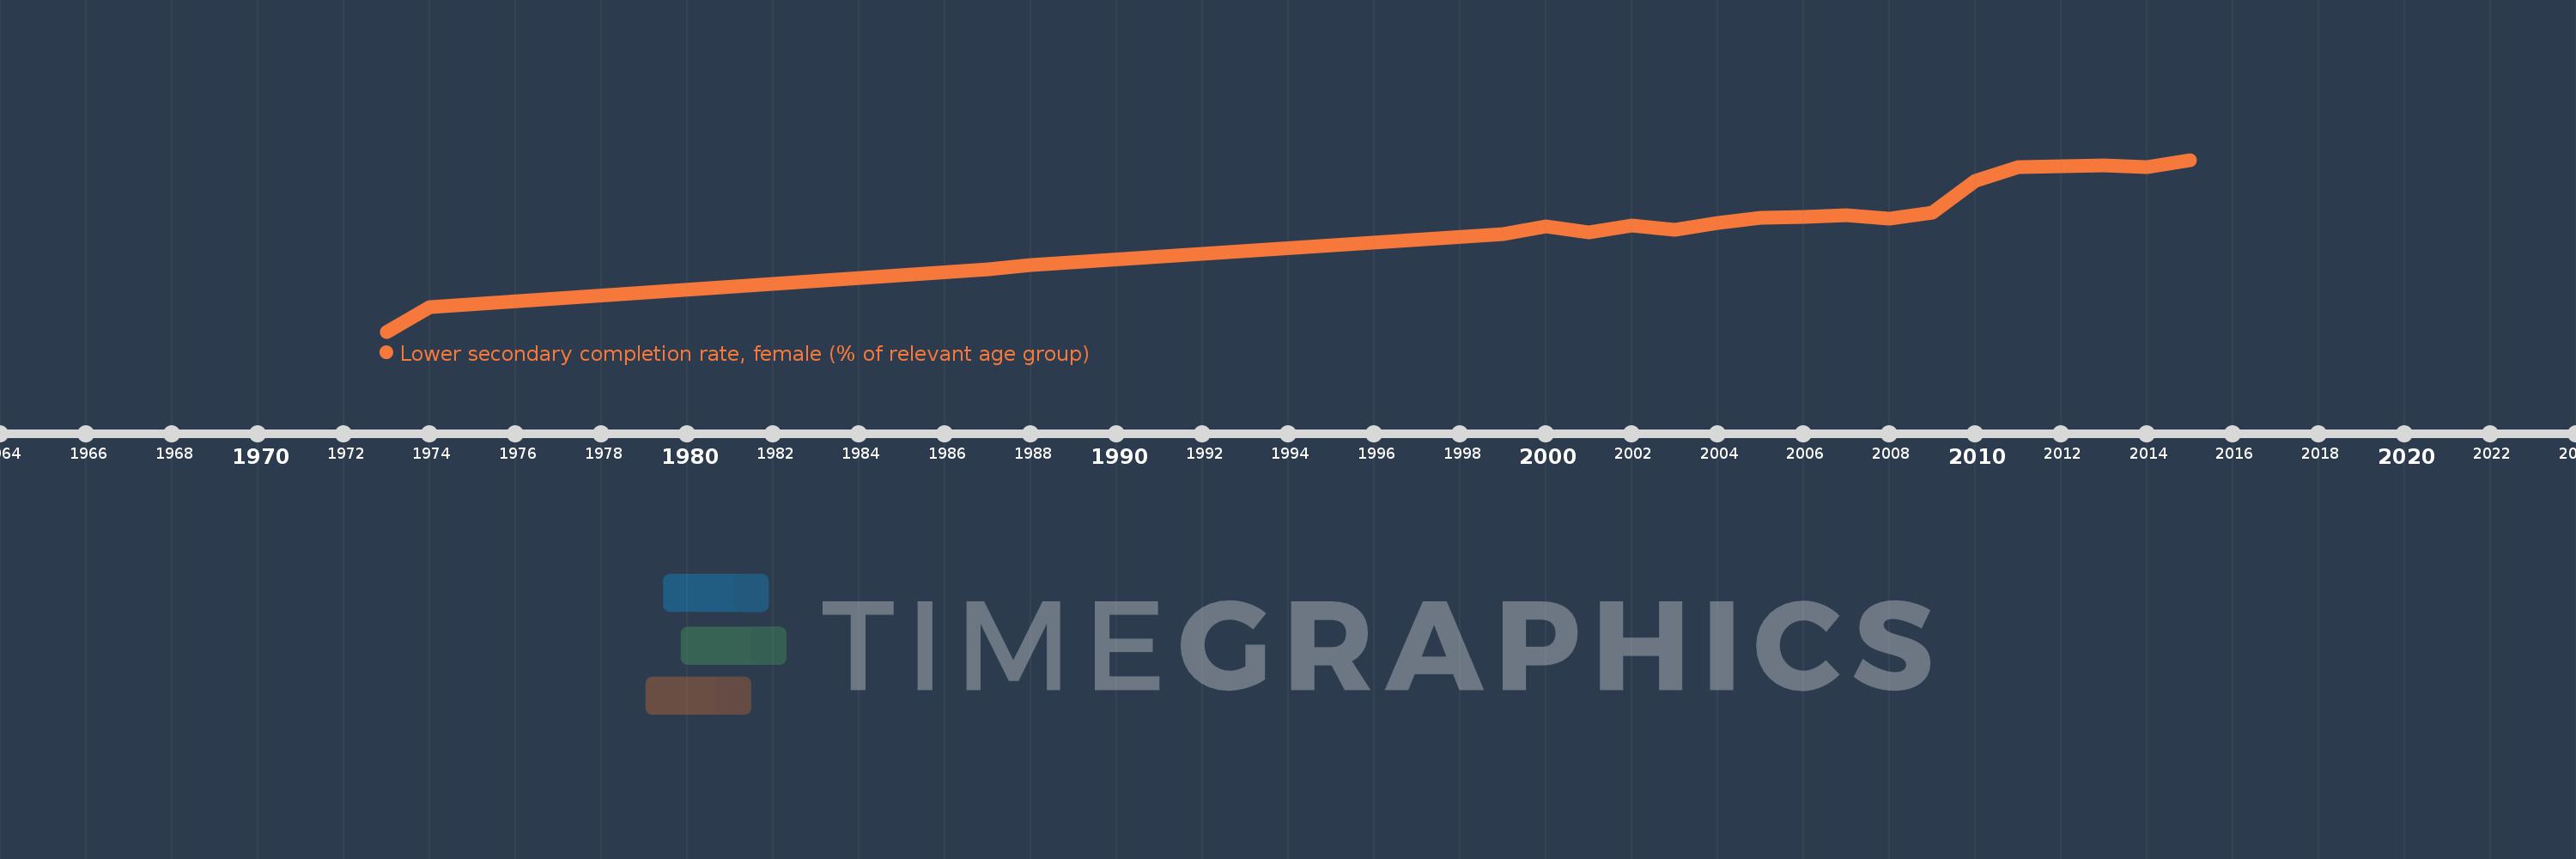
Lesotho
LSO
true
2
1
Lower secondary completion rate, female (% of relevant age group)
2015,2014,2013,2011,2010,2009,2008,2007,2006,2005,2004,2003,2002,2001,2000,1999,1988,1987,1974,1973