33
/
AIzaSyB4mHJ5NPEv-XzF7P6NDYXjlkCWaeKw5bc
November 30, 2025
177016
Lebanon
LBN
true
2
1
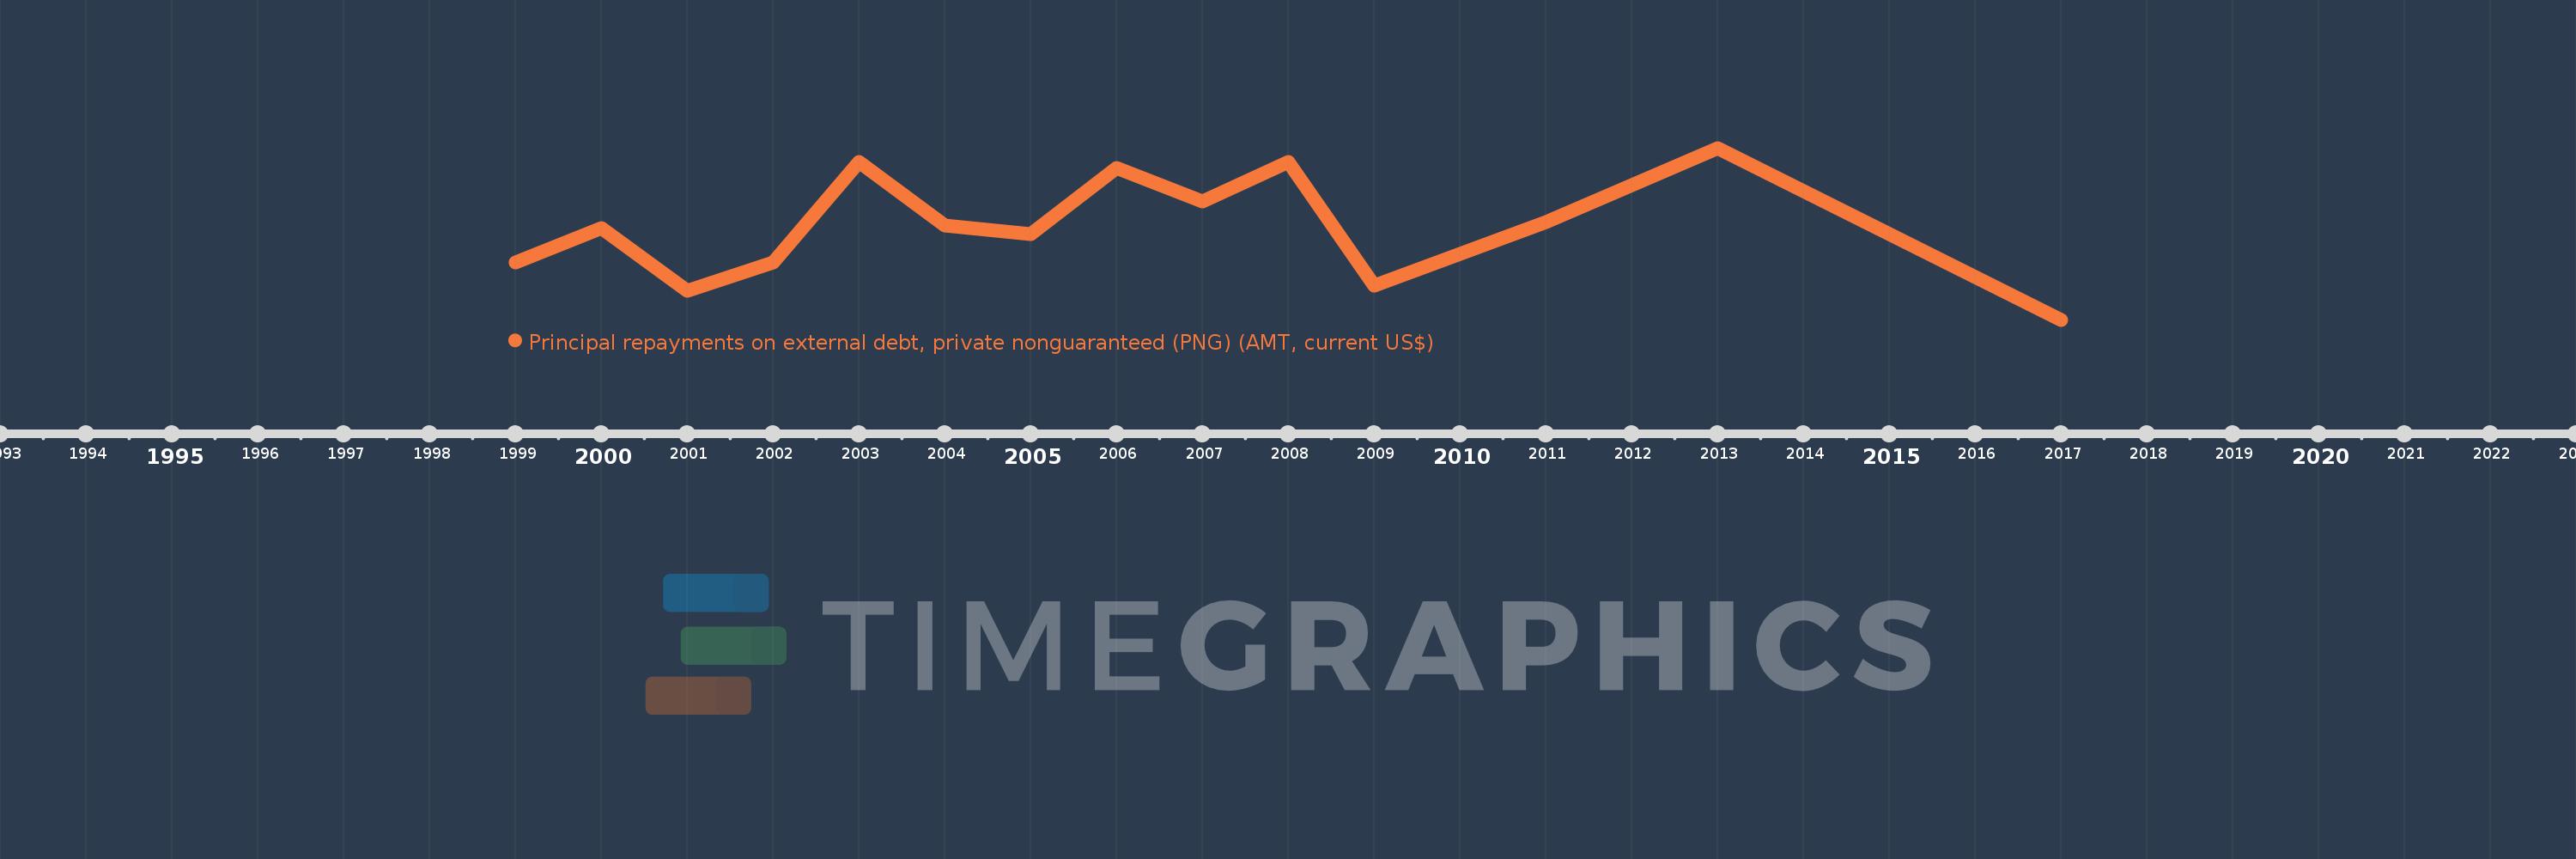
Principal repayments on external debt, private nonguaranteed (PNG) (AMT, current US$)
2017,2013,2011,2009,2008,2007,2006,2005,2004,2003,2002,2001,2000,1999
Create a timeline
Public Timelines
For education
For educational institutions
For teachers
For students
Cabinet
For educational institutions
For teachers
For students
Open cabinet
FAQ
Close
Create a timeline
Public timelines
FAQ
About & Feedback
Terms
Privacy
FAQ
Support 24/7
Cabinet
Get premium
Donate
Download
Global statistics library
→
Lebanon
→
Principal repayments on external debt, private nonguaranteed (PNG) (AMT, current US$)
This statistics in other country:
Albania
Algeria
Argentina
Armenia
Azerbaijan
Bangladesh
Belarus
Belize
Bhutan
Bolivia
Bosnia and Herzegovina
Botswana
Brazil
Bulgaria
Cambodia
Cameroon
China
Colombia
Costa Rica
Cote d'Ivoire
Dominican Republic
East Asia & Pacific (excluding high income)
Ecuador
Egypt, Arab Rep.
El Salvador
Europe & Central Asia (excluding high income)
Fiji
Georgia
Ghana
Guatemala
Guyana
Haiti
Honduras
IDA only
India
Indonesia
Jamaica
Jordan
Kazakhstan
Kenya
Kosovo
Kyrgyz Republic
Lao PDR
Latin America & Caribbean (excluding high income)
Lebanon
Liberia
Low & middle income
Low income
Lower middle income
Macedonia, FYR
Madagascar
Malawi
Malaysia
Maldives
Mauritius
Mexico
Middle East & North Africa (excluding high income)
Middle income
Moldova
Mongolia
Montenegro
Morocco
Myanmar
Nicaragua
Niger
Nigeria
Pakistan
Panama
Papua New Guinea
Paraguay
Peru
Philippines
Romania
Russian Federation
Senegal
Serbia
Solomon Islands
South Africa
South Asia
Sri Lanka
Sub-Saharan Africa (excluding high income)
Tajikistan
Tanzania
Thailand
Tunisia
Turkey
Turkmenistan
Ukraine
Upper middle income
Uzbekistan
Venezuela, RB
Vietnam
Zambia
Zimbabwe
Timeline:
This timeline shows a graph from
1999
to
2017
of Lebanon. No data until
1998
. Number of actual observations by date:
14
.
Source name:
World Development Indicators
Source organization:
World Bank, International Debt Statistics.
Categories, topics:
External Debt
Last updated:
apr 23, 2017
Indicators value changes by year
Meaning:
162.571 mln
Minimum:
0.0
jan 1, 2017
Maximum:
300.0 mln
jan 1, 2013
At the date of observation
Value
Absolute change
Change from the previous value
jan 1, 1999
100.0 mln
+100.0 mln
0.0%
jan 1, 2000
160.0 mln
+60.0 mln
60.0%
jan 1, 2001
50.0 mln
-110.0 mln
-68.75%
jan 1, 2002
100.0 mln
+50.0 mln
100.0%
jan 1, 2003
275.0 mln
+175.0 mln
175.0%
jan 1, 2004
165.0 mln
-110.0 mln
-40.0%
jan 1, 2005
150.0 mln
-15.0 mln
-9.09%
jan 1, 2006
265.0 mln
+115.0 mln
76.67%
jan 1, 2007
206.0 mln
-59.0 mln
-22.26%
jan 1, 2008
275.0 mln
+69.0 mln
33.5%
jan 1, 2009
60.0 mln
-215.0 mln
-78.18%
jan 1, 2011
170.0 mln
+110.0 mln
183.33%
jan 1, 2013
300.0 mln
+130.0 mln
76.47%
jan 1, 2017
0.0
-300.0 mln
-100.0%
Ranking of countries by current statistics by years
About & Feedback
Terms
Privacy
FAQ
Support 24/7
Cabinet
Get premium
Donate
The service accepts bank transfer (ACH, Wire) or cards (Visa, MasterCard, etc). Processed by Stripe.
Secured with SSL