Download This statistics in other country:
Timeline:
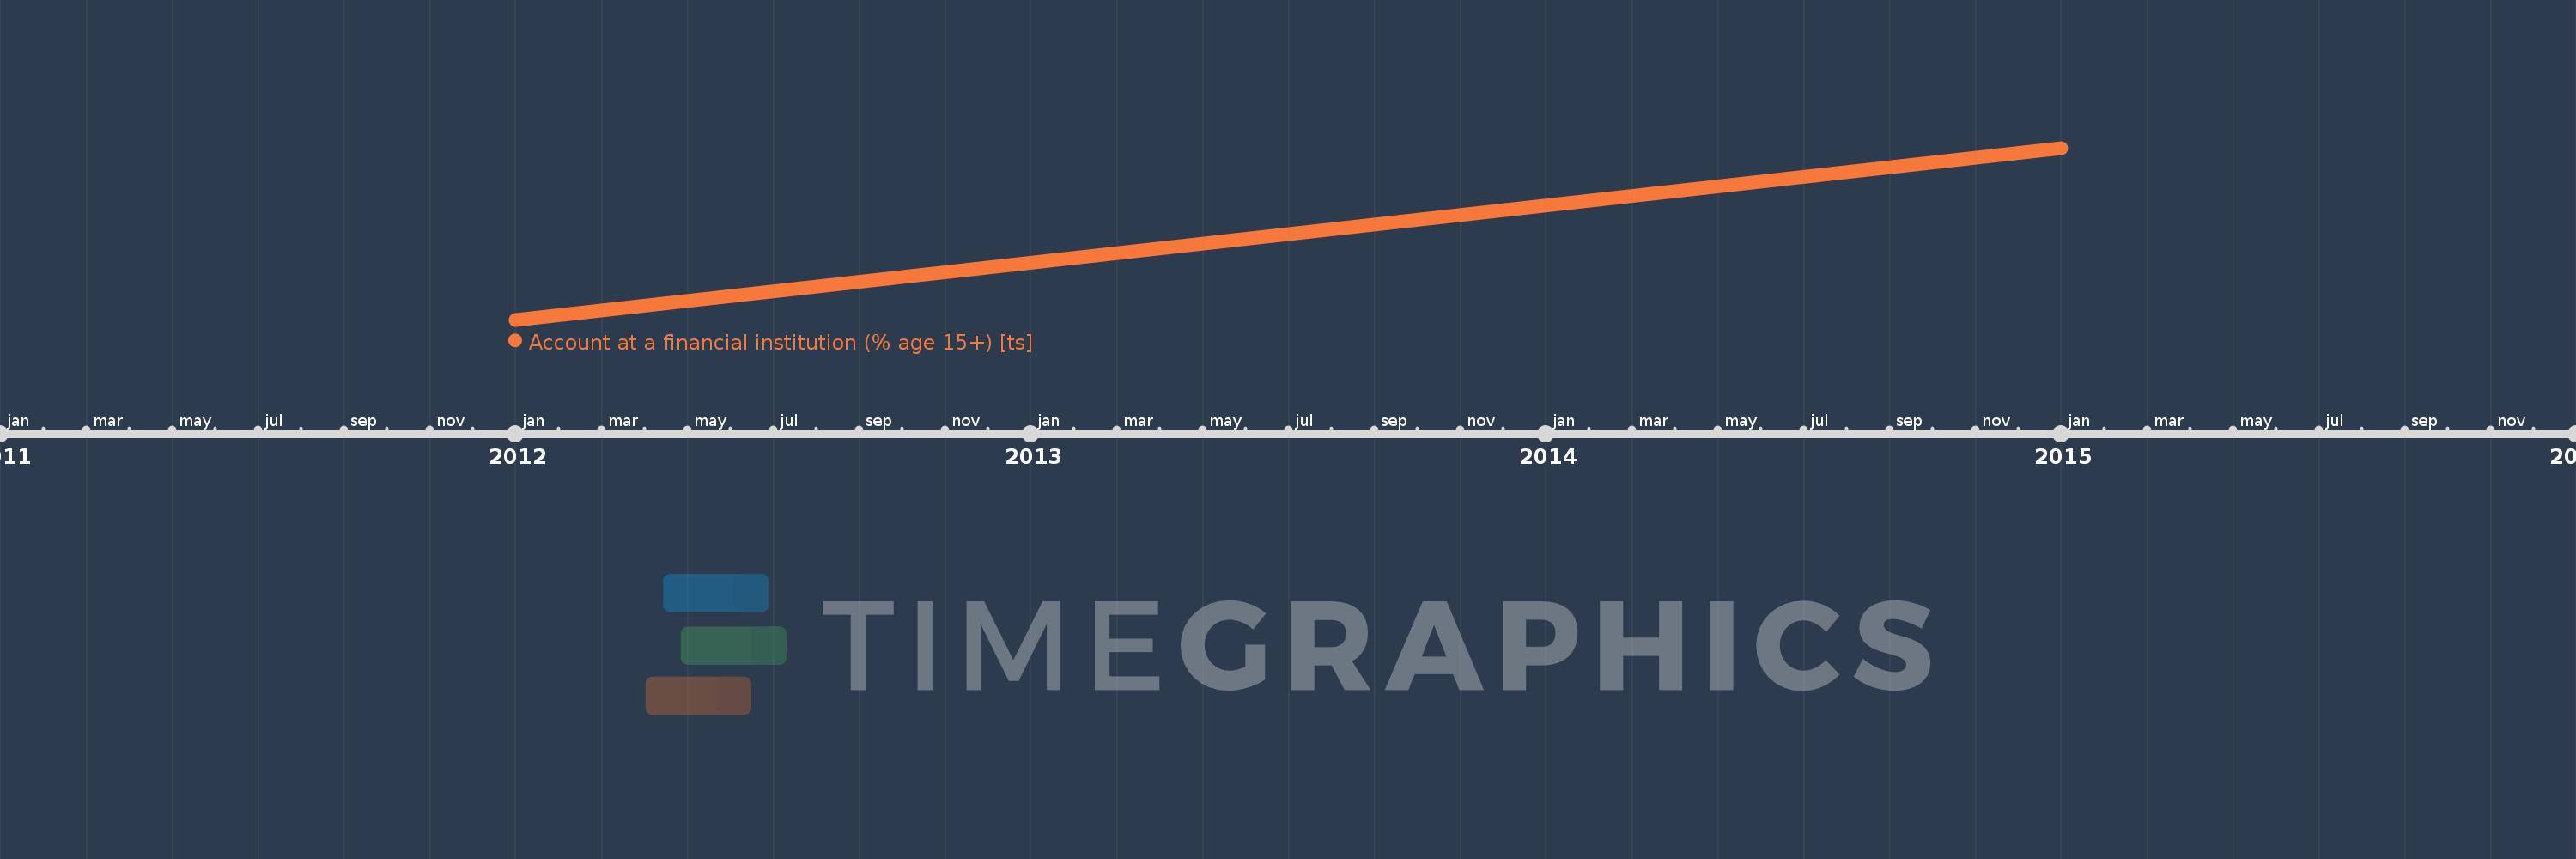
This timeline shows a graph from 2012 to 2015 of Latvia. No data until 2011. Number of actual observations by date: 2.
Source name:
World Development Indicators
Source organization:
Demirguc-Kunt et al., 2015
Categories, topics:
Financial Sector
Last updated:
apr 23, 2017
Indicators value changes by year
Minimum:
89.659
jan 1, 2012
Maximum:
90.218
jan 1, 2015
At the date of observation
Value
Absolute change
Change from the previous value
jan 1, 2012
89.659
+89.659
0.0%
jan 1, 2015
90.218
+0.559
0.62%
Ranking of countries by current statistics by years