Download This statistics in other country:
Timeline:
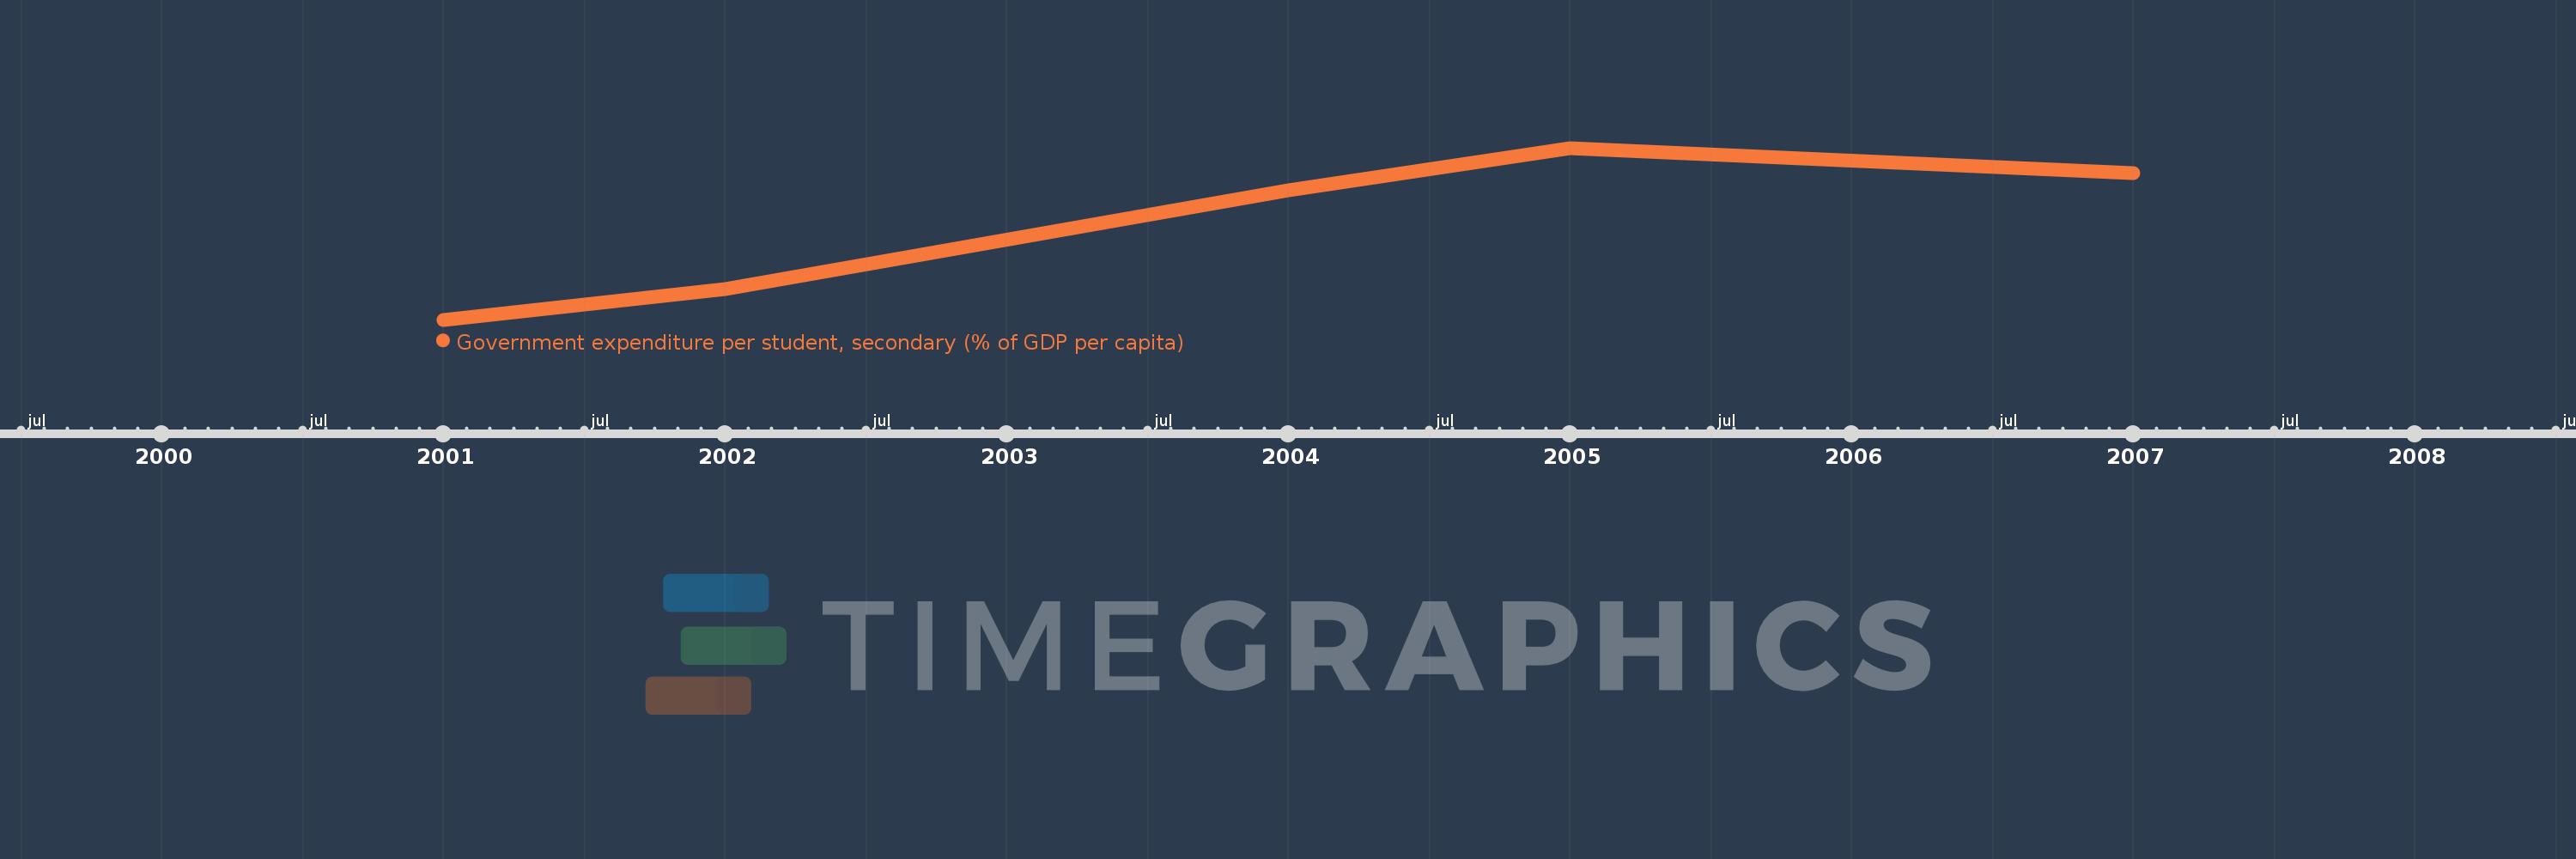
This timeline shows a graph from 2001 to 2007 of Kenya. No data until 2000. Number of actual observations by date: 5.
Source name:
World Development Indicators
Source organization:
United Nations Educational, Scientific, and Cultural Organization (UNESCO) Institute for Statistics.
Categories, topics:
Education
Last updated:
apr 23, 2017
Indicators value changes by year
Minimum:
14.296
jan 1, 2001
Maximum:
22.038
jan 1, 2005
At the date of observation
Value
Absolute change
Change from the previous value
jan 1, 2001
14.296
+14.296
0.0%
jan 1, 2002
15.694
+1.399
9.78%
jan 1, 2004
20.146
+4.452
28.37%
jan 1, 2005
22.038
+1.891
9.39%
jan 1, 2007
20.908
-1.129
-5.12%
Ranking of countries by current statistics by years