Download This statistics in other country:
Timeline:
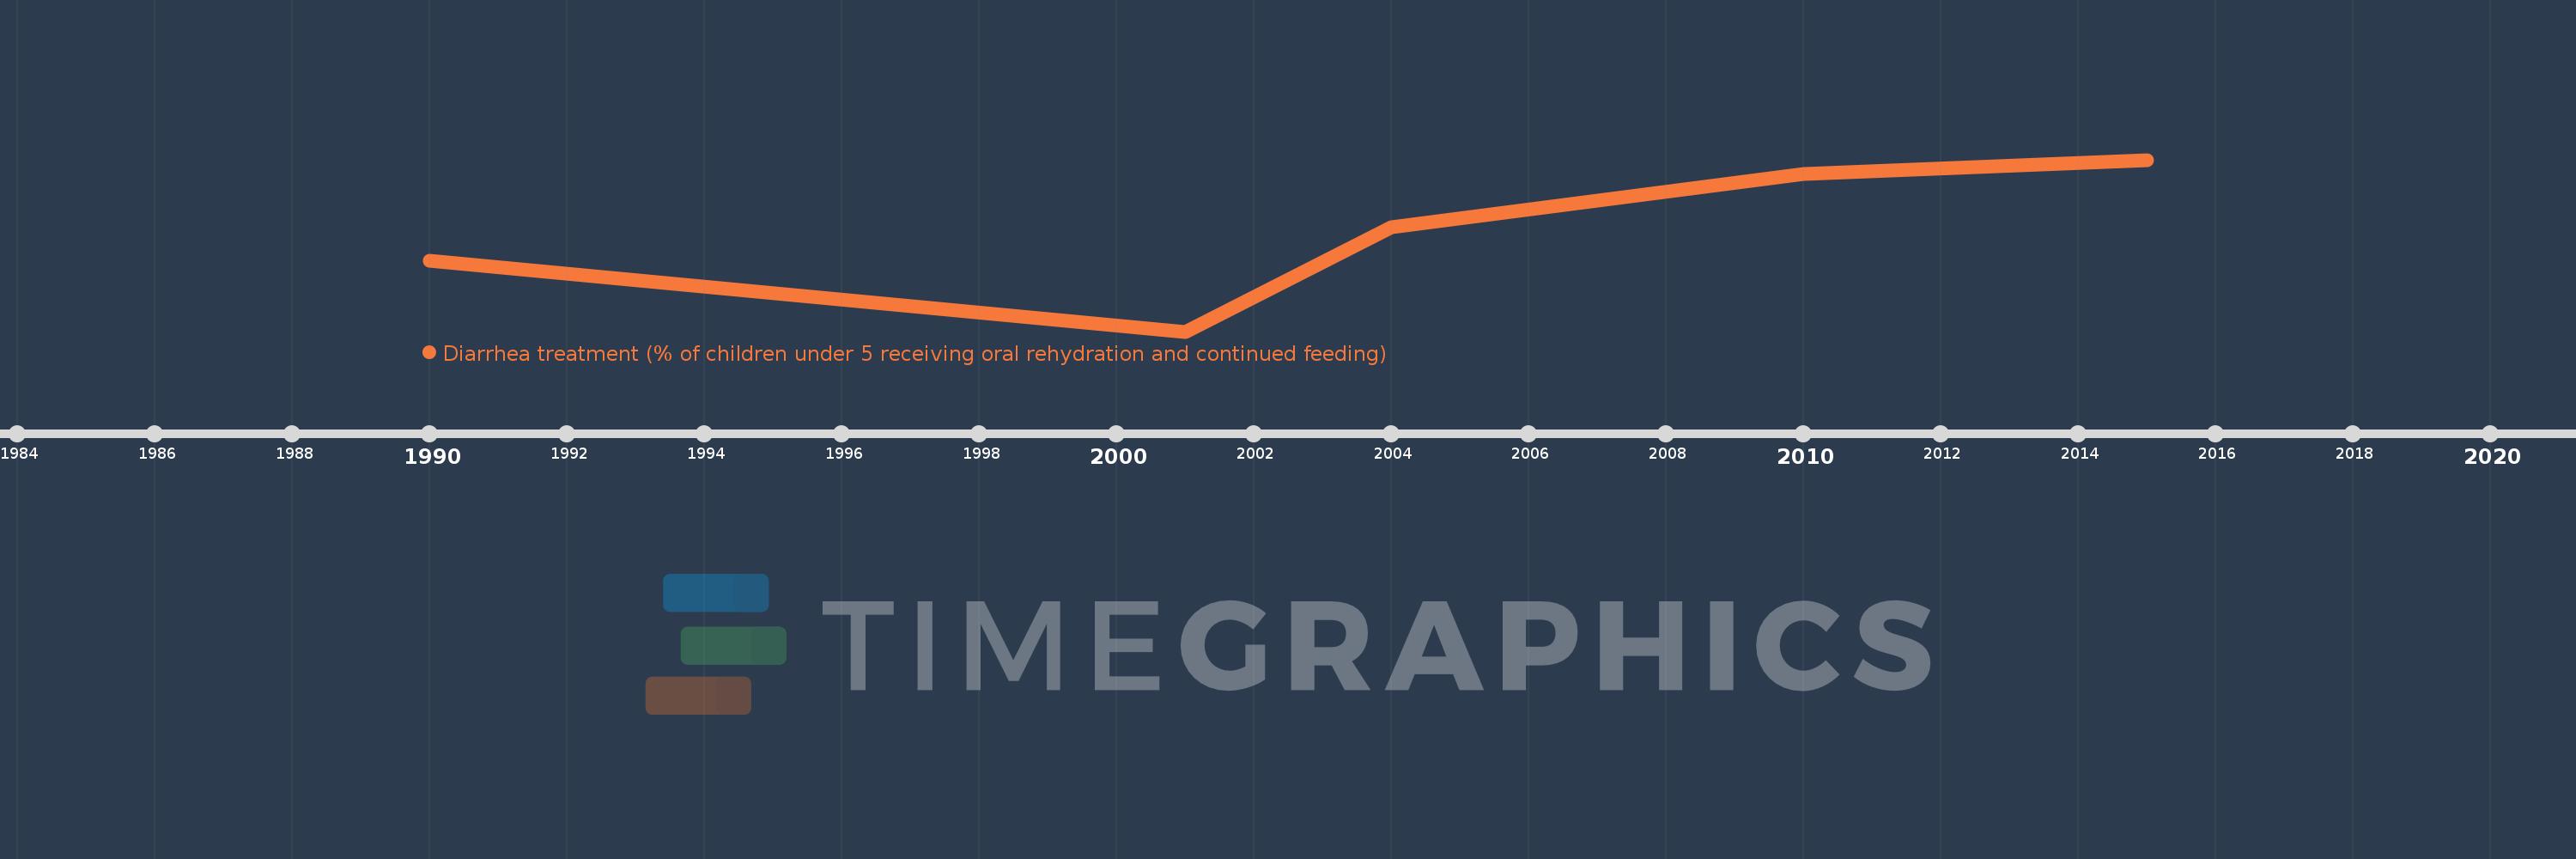
This timeline shows a graph from 1990 to 2015 of Kenya. No data until 1989. Number of actual observations by date: 5.
Source name:
World Development Indicators
Source organization:
UNICEF, State of the World's Children, Childinfo, and Demographic and Health Surveys.
Categories, topics:
Health
Last updated:
apr 23, 2017
Indicators value changes by year
At the date of observation
Value
Absolute change
Change from the previous value
jan 1, 1990
27.4
+27.4
0.0%
jan 1, 2001
15.0
-12.4
-45.26%
jan 1, 2004
33.3
+18.3
122.0%
jan 1, 2010
42.6
+9.3
27.93%
jan 1, 2015
45.1
+2.5
5.87%
Ranking of countries by current statistics by years