33
/
AIzaSyB4mHJ5NPEv-XzF7P6NDYXjlkCWaeKw5bc
November 30, 2025
166702
Kazakhstan
KAZ
true
2
1
PPG, IBRD (NTR, current US$)
2016,2015,2014,2013,2012,2011,2010,2009,2008,2007,2006,2005,2004,2003,2002,2001,2000,1999,1998,1997,1996,1995
Create a timeline
Public Timelines
For education
For educational institutions
For teachers
For students
Cabinet
For educational institutions
For teachers
For students
Open cabinet
FAQ
Close
Create a timeline
Public timelines
FAQ
About & Feedback
Terms
Privacy
FAQ
Support 24/7
Cabinet
Get premium
Donate
Download
Global statistics library
→
Kazakhstan
→
PPG, IBRD (NTR, current US$)
This statistics in other country:
Albania
Algeria
Angola
Argentina
Armenia
Azerbaijan
Bangladesh
Belarus
Belize
Bolivia
Bosnia and Herzegovina
Botswana
Brazil
Bulgaria
Burundi
Cabo Verde
Cameroon
Chad
China
Colombia
Congo, Dem. Rep.
Congo, Rep.
Costa Rica
Cote d'Ivoire
Dominica
Dominican Republic
East Asia & Pacific (excluding high income)
Ecuador
Egypt, Arab Rep.
El Salvador
Ethiopia
Europe & Central Asia (excluding high income)
Fiji
Gabon
Georgia
Ghana
Grenada
Guatemala
Guinea
Guyana
Haiti
Honduras
IDA only
India
Indonesia
Iran, Islamic Rep.
Jamaica
Jordan
Kazakhstan
Kenya
Kosovo
Latin America & Caribbean (excluding high income)
Lebanon
Lesotho
Liberia
Low & middle income
Low income
Lower middle income
Macedonia, FYR
Madagascar
Malawi
Malaysia
Mauritania
Mauritius
Mexico
Middle East & North Africa (excluding high income)
Middle income
Moldova
Montenegro
Morocco
Myanmar
Nicaragua
Nigeria
Pakistan
Panama
Papua New Guinea
Paraguay
Peru
Philippines
Romania
Russian Federation
Senegal
Serbia
Sierra Leone
South Africa
South Asia
Sri Lanka
St. Lucia
St. Vincent and the Grenadines
Sub-Saharan Africa (excluding high income)
Sudan
Swaziland
Syrian Arab Republic
Tanzania
Thailand
Togo
Tunisia
Turkey
Turkmenistan
Uganda
Ukraine
Upper middle income
Uzbekistan
Venezuela, RB
Vietnam
Zambia
Zimbabwe
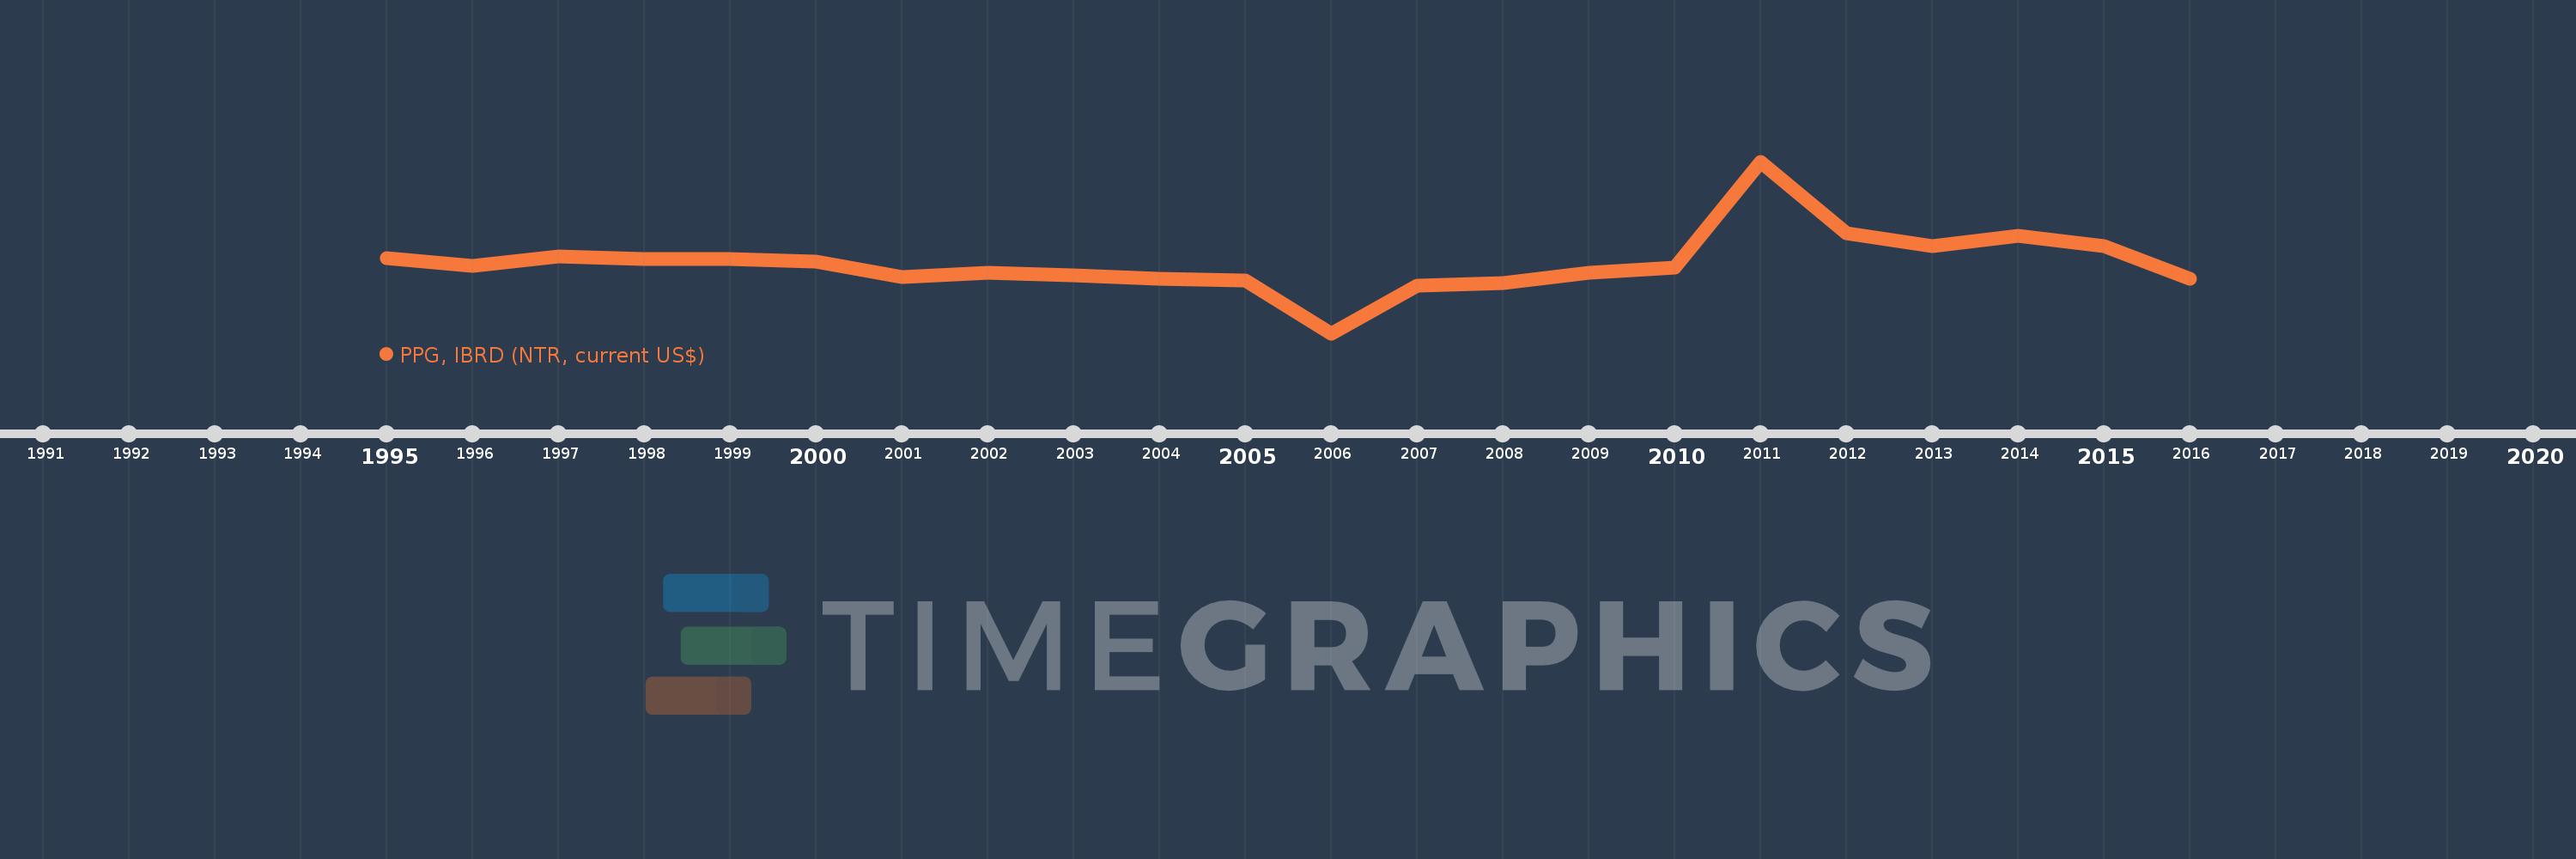
Timeline:
This timeline shows a graph from
1995
to
2016
of Kazakhstan. No data until
1994
. Number of actual observations by date:
22
.
Source name:
World Development Indicators
Source organization:
World Bank, International Debt Statistics.
Categories, topics:
External Debt
Last updated:
apr 23, 2017
Indicators value changes by year
Meaning:
122.835 mln
Minimum:
-675.231 mln
jan 1, 2006
Maximum:
1.276 bln
jan 1, 2011
At the date of observation
Value
Absolute change
Change from the previous value
jan 1, 1995
175.092 mln
+175.092 mln
0.0%
jan 1, 1996
93.258 mln
-81.834 mln
-46.74%
jan 1, 1997
200.812 mln
+107.554 mln
115.33%
jan 1, 1998
167.263 mln
-33.549 mln
-16.71%
jan 1, 1999
167.133 mln
-130.0K
-0.08%
jan 1, 2000
137.484 mln
-29.649 mln
-17.74%
jan 1, 2001
-32.752 mln
-170.236 mln
-123.82%
jan 1, 2002
13.278 mln
+46.03 mln
-140.54%
jan 1, 2003
-14.625 mln
-27.903 mln
-210.14%
jan 1, 2004
-51.908 mln
-37.283 mln
254.93%
jan 1, 2005
-71.656 mln
-19.748 mln
38.04%
jan 1, 2006
-675.231 mln
-603.575 mln
842.32%
jan 1, 2007
-132.435 mln
+542.796 mln
-80.39%
jan 1, 2008
-104.83 mln
+27.605 mln
-20.84%
jan 1, 2009
17.238 mln
+122.068 mln
-116.44%
jan 1, 2010
66.937 mln
+49.699 mln
288.31%
jan 1, 2011
1.276 bln
+1.209 bln
1.81K%
jan 1, 2012
462.889 mln
-812.871 mln
-63.72%
jan 1, 2013
312.4 mln
-150.489 mln
-32.51%
jan 1, 2014
433.802 mln
+121.402 mln
38.86%
jan 1, 2015
315.255 mln
-118.547 mln
-27.33%
jan 1, 2016
-52.794 mln
-368.049 mln
-116.75%
Ranking of countries by current statistics by years
About & Feedback
Terms
Privacy
FAQ
Support 24/7
Cabinet
Get premium
Donate
The service accepts bank transfer (ACH, Wire) or cards (Visa, MasterCard, etc). Processed by Stripe.
Secured with SSL