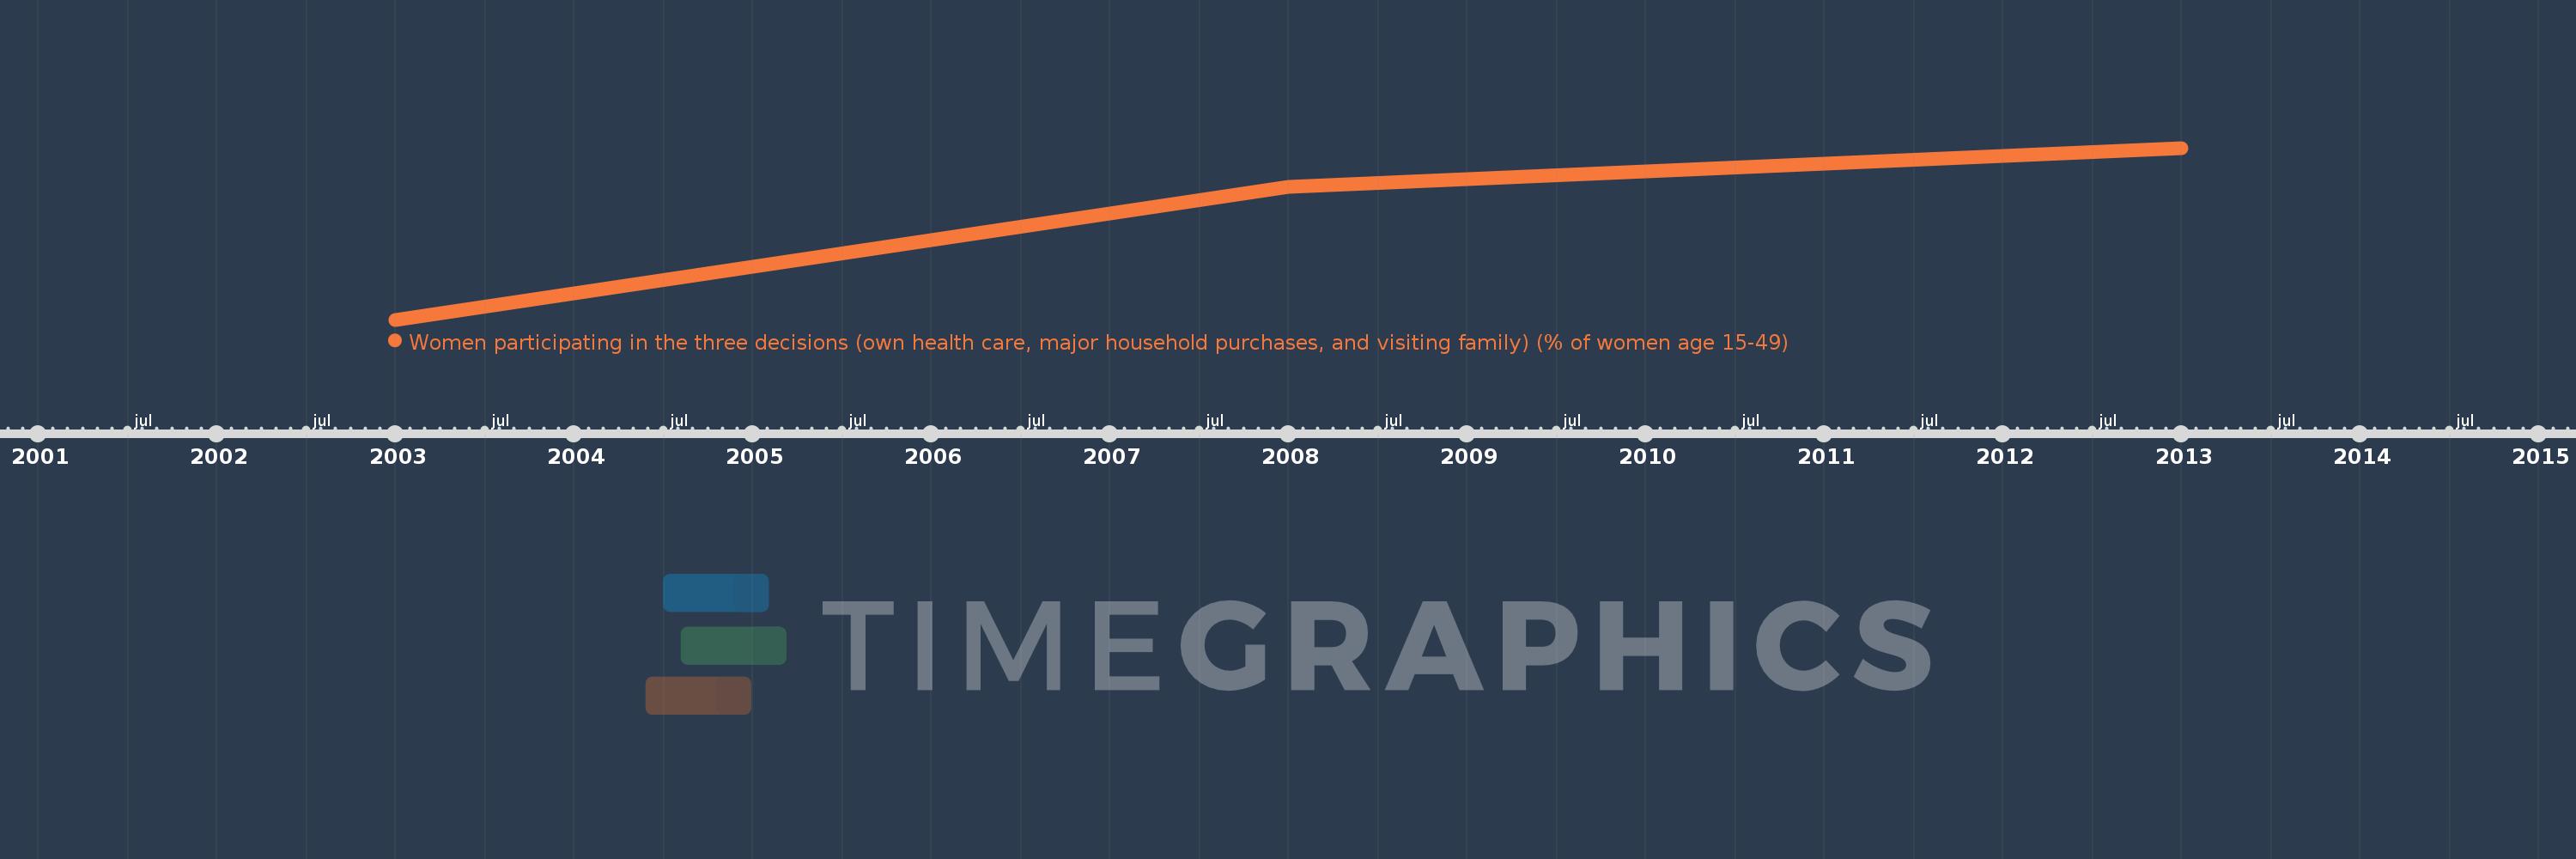
Download Global statistics library →Jordan →Women participating in the three decisions (own health care, major household purchases, and visiting family) (% of women age 15-49)
This statistics in other country:
Timeline:
This timeline shows a graph from 2003 to 2013 of Jordan. No data until 2002. Number of actual observations by date: 3.
Source name:
World Development Indicators
Source organization:
Demographic and Health Surveys (DHS)
Categories, topics:
Gender
Last updated:
apr 23, 2017
Indicators value changes by year
At the date of observation
Value
Absolute change
Change from the previous value
jan 1, 2003
53.1
+53.1
0.0%
jan 1, 2008
62.4
+9.3
17.51%
jan 1, 2013
65.1
+2.7
4.33%
Ranking of countries by current statistics by years