Download This statistics in other country:
Timeline:
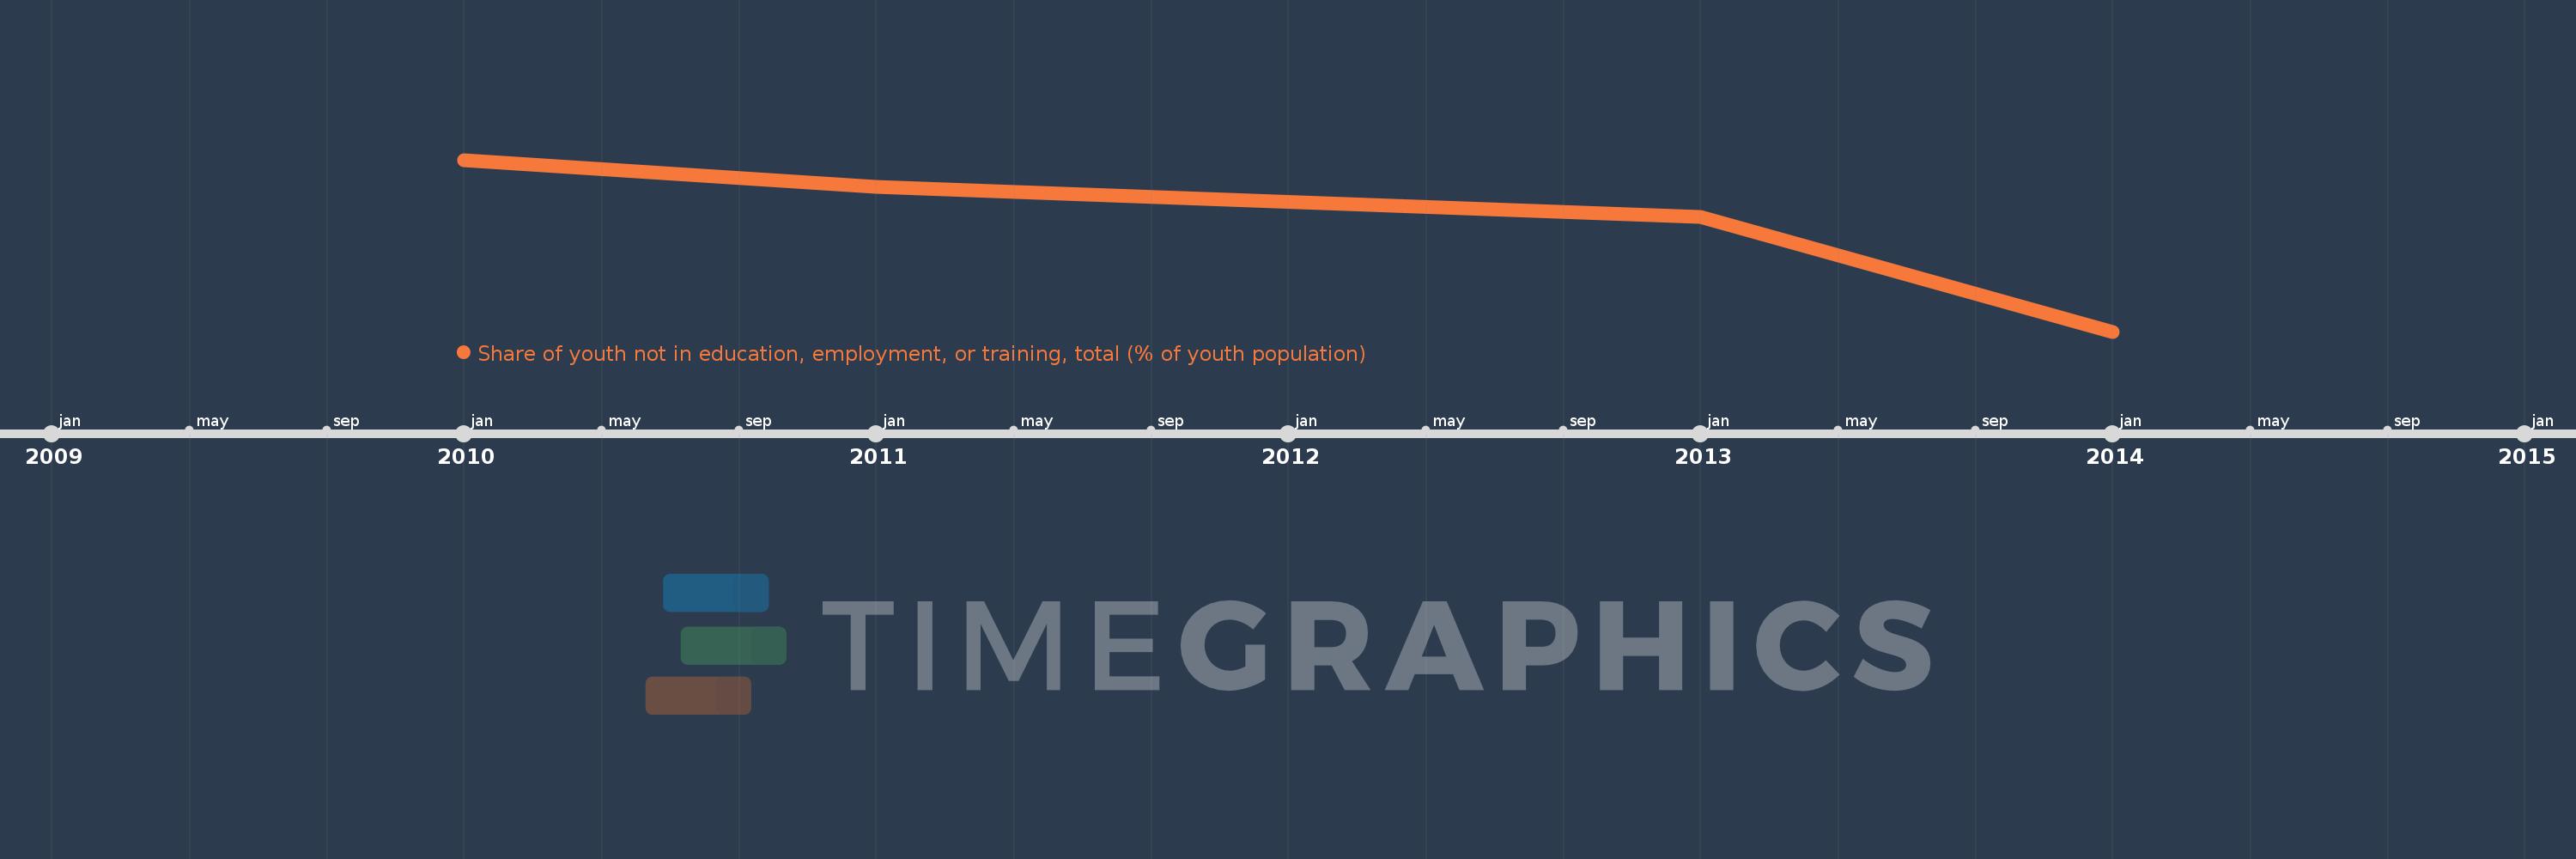
This timeline shows a graph from 2010 to 2014 of Japan. No data until 2009. Number of actual observations by date: 4.
Source name:
World Development Indicators
Source organization:
International Labour Organization, Key Indicators of the Labour Market database.
Categories, topics:
Social Protection & Labor
Last updated:
apr 23, 2017
Indicators value changes by year
At the date of observation
Value
Absolute change
Change from the previous value
jan 1, 2010
4.36
+4.36
0.0%
jan 1, 2011
4.29
-0.07
-1.61%
jan 1, 2013
4.21
-0.08
-1.86%
jan 1, 2014
3.91
-0.3
-7.13%
Ranking of countries by current statistics by years