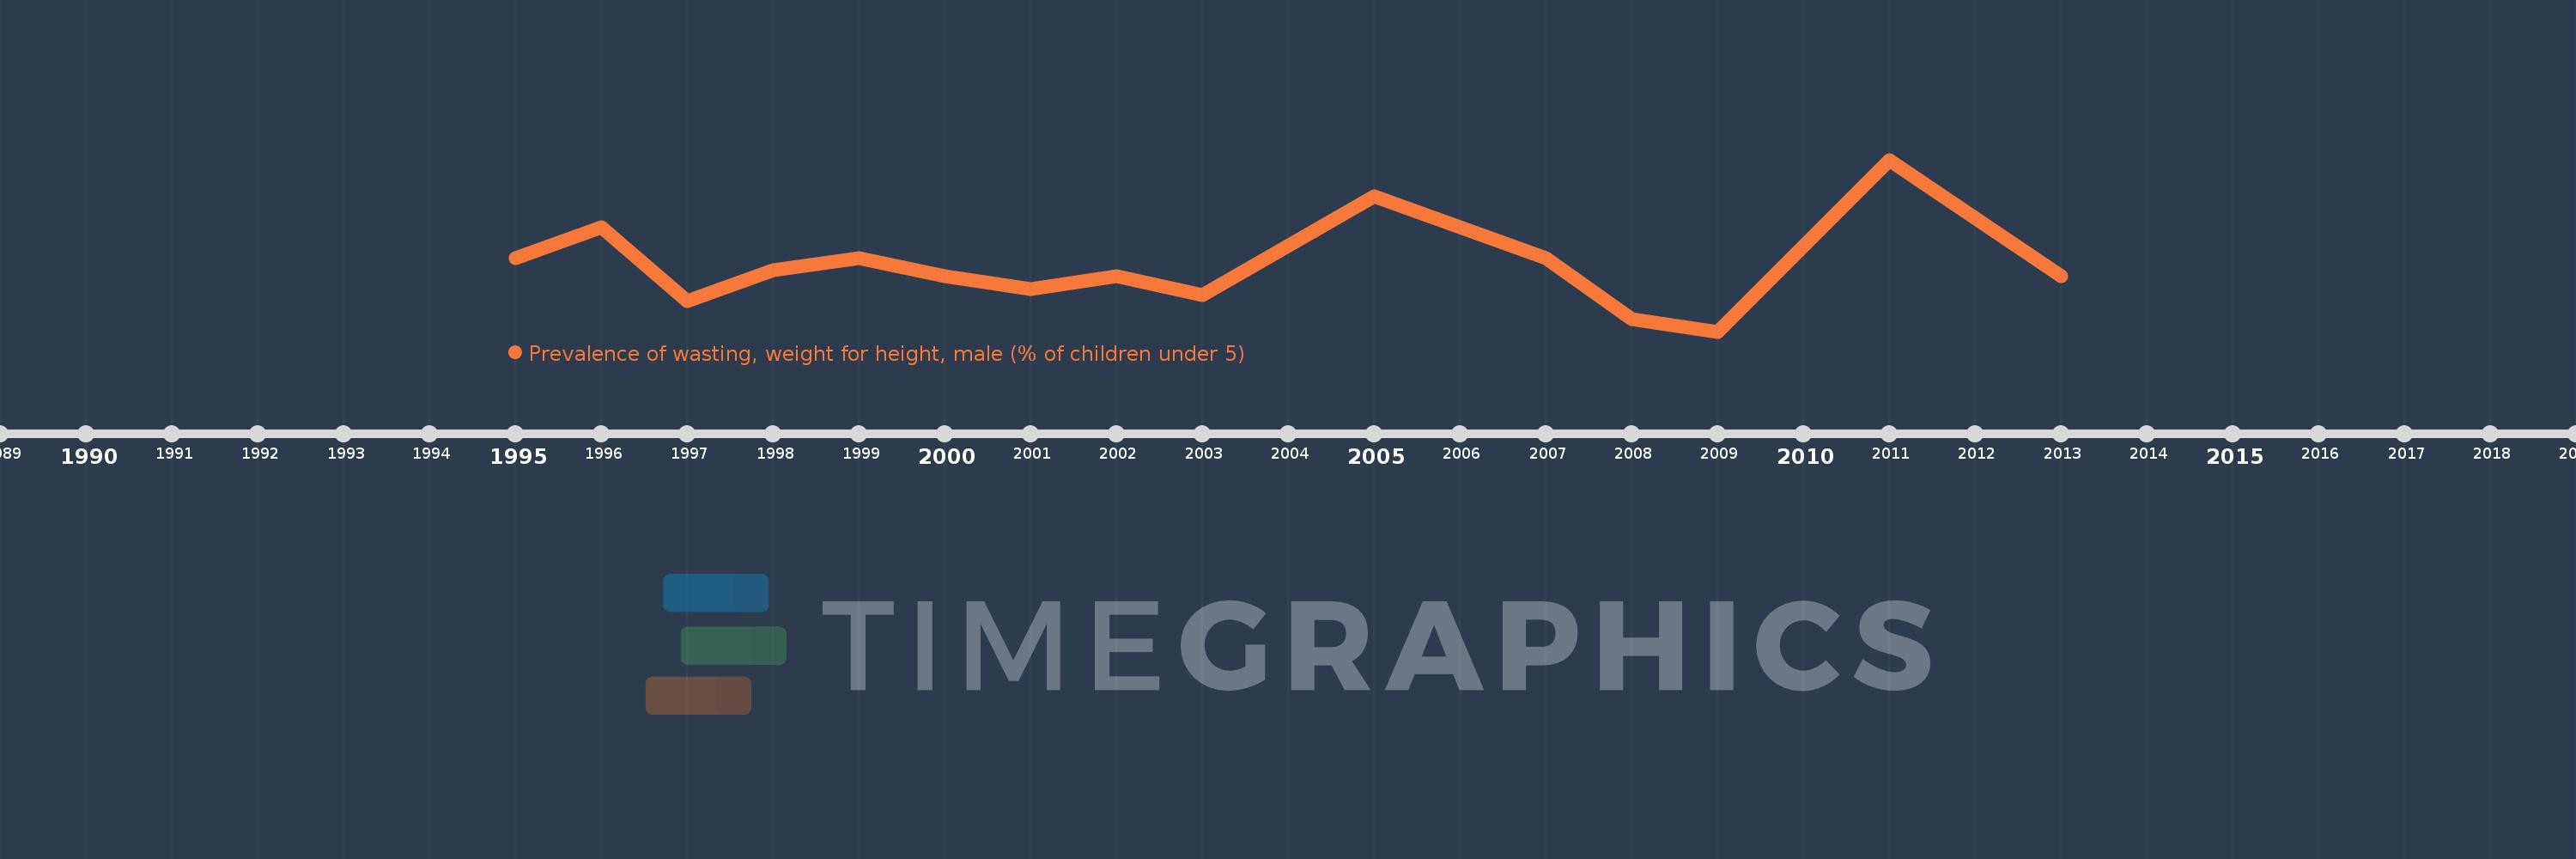
This timeline shows a graph from 1995 to 2013 of Jamaica. No data until 1994. Number of actual observations by date: 15.
Source name:
World Development Indicators
Source organization:
World Health Organization, Global Database on Child Growth and Malnutrition. Country-level data are unadjusted data from national surveys, and thus may not be comparable across countries.
Categories, topics:
Health
Last updated:
apr 23, 2017
Indicators value changes by year
Meaning:
3.167
Minimum:
2.1
jan 1, 2009
Maximum:
4.9
jan 1, 2011
At the date of observation
Value
Absolute change
Change from the previous value
jan 1, 1995
3.3
+3.3
0.0%
jan 1, 1996
3.8
+0.5
15.15%
jan 1, 1997
2.6
-1.2
-31.58%
jan 1, 1998
3.1
+0.5
19.23%
jan 1, 1999
3.3
+0.2
6.45%
jan 1, 2000
3.0
-0.3
-9.09%
jan 1, 2001
2.8
-0.2
-6.67%
jan 1, 2002
3.0
+0.2
7.14%
jan 1, 2003
2.7
-0.3
-10.0%
jan 1, 2005
4.3
+1.6
59.26%
jan 1, 2007
3.3
-1.0
-23.26%
jan 1, 2008
2.3
-1.0
-30.3%
jan 1, 2009
2.1
-0.2
-8.7%
jan 1, 2011
4.9
+2.8
133.33%
jan 1, 2013
3.0
-1.9
-38.78%
Ranking of countries by current statistics by years