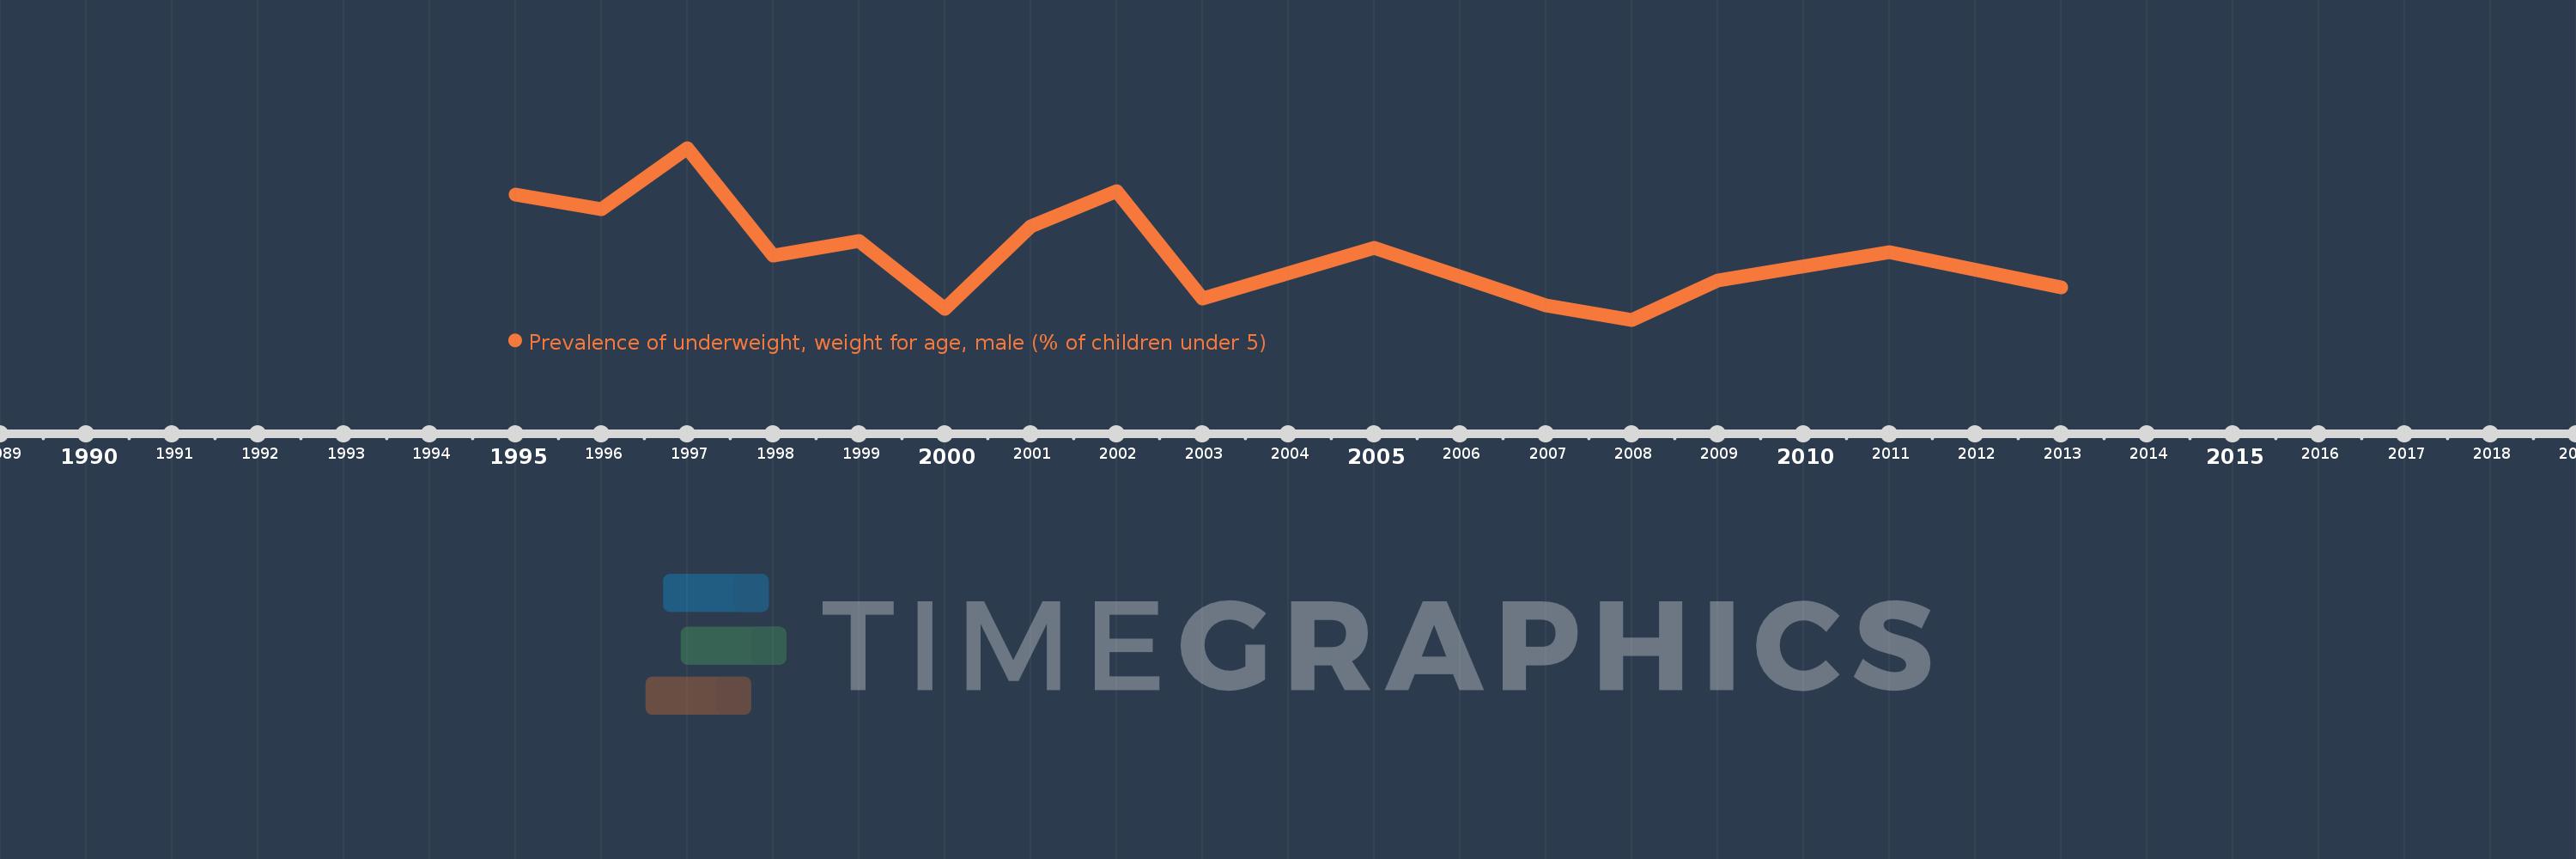
This timeline shows a graph from 1995 to 2013 of Jamaica. No data until 1994. Number of actual observations by date: 15.
Source name:
World Development Indicators
Source organization:
World Health Organization, Global Database on Child Growth and Malnutrition. Country-level data are unadjusted data from national surveys, and thus may not be comparable across countries.
Categories, topics:
Health, Gender
Last updated:
apr 23, 2017
Indicators value changes by year
Meaning:
3.82
Minimum:
1.9
jan 1, 2008
Maximum:
6.7
jan 1, 1997
At the date of observation
Value
Absolute change
Change from the previous value
jan 1, 1995
5.4
+5.4
0.0%
jan 1, 1996
5.0
-0.4
-7.41%
jan 1, 1997
6.7
+1.7
34.0%
jan 1, 1998
3.7
-3.0
-44.78%
jan 1, 1999
4.1
+0.4
10.81%
jan 1, 2000
2.2
-1.9
-46.34%
jan 1, 2001
4.5
+2.3
104.55%
jan 1, 2002
5.5
+1.0
22.22%
jan 1, 2003
2.5
-3.0
-54.55%
jan 1, 2005
3.9
+1.4
56.0%
jan 1, 2007
2.3
-1.6
-41.03%
jan 1, 2008
1.9
-0.4
-17.39%
jan 1, 2009
3.0
+1.1
57.89%
jan 1, 2011
3.8
+0.8
26.67%
jan 1, 2013
2.8
-1.0
-26.32%
Ranking of countries by current statistics by years