33
/
AIzaSyB4mHJ5NPEv-XzF7P6NDYXjlkCWaeKw5bc
November 30, 2025
158344
Iraq
IRQ
true
2
1
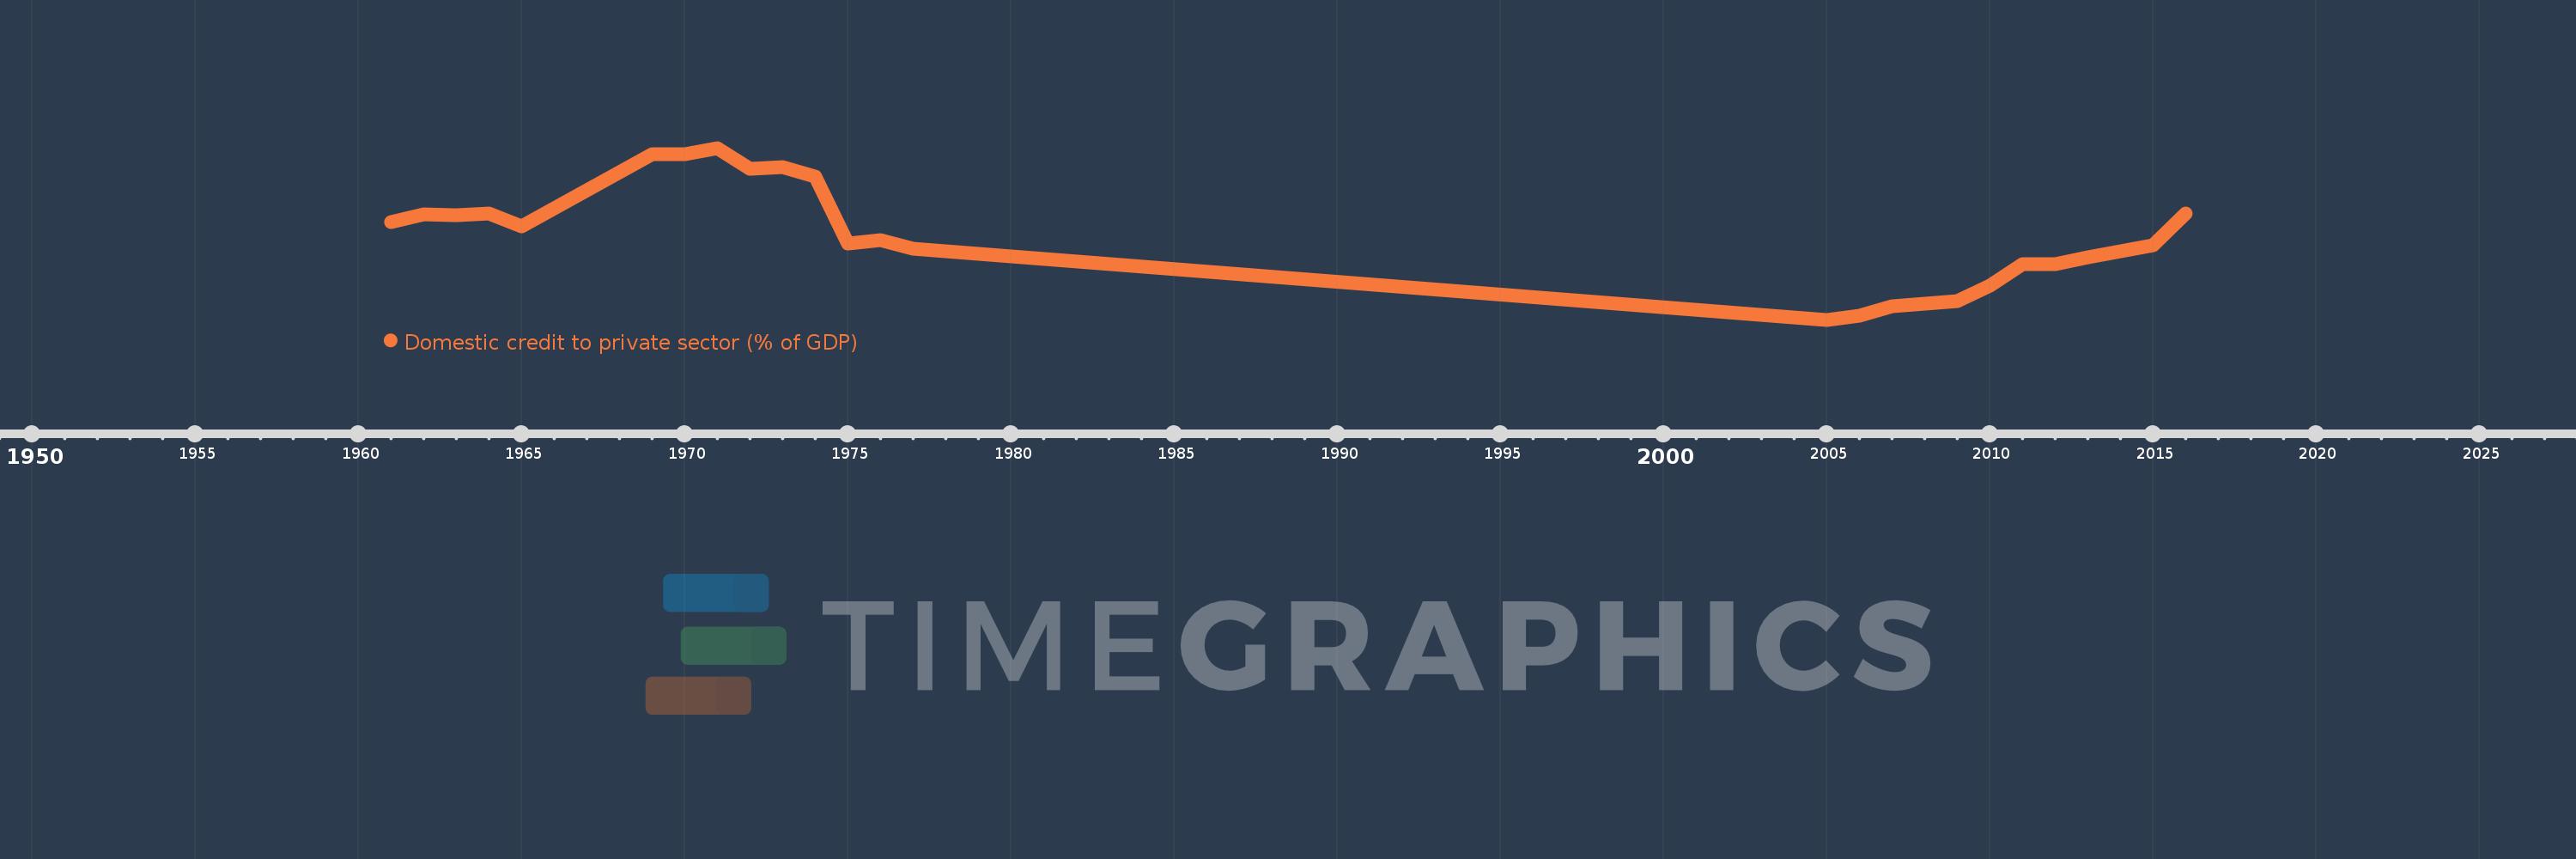
Domestic credit to private sector (% of GDP)
2016,2015,2014,2013,2012,2011,2010,2009,2008,2007,2006,2005,1977,1976,1975,1974,1973,1972,1971,1970,1969,1965,1964,1963,1962,1961