33
/
AIzaSyB4mHJ5NPEv-XzF7P6NDYXjlkCWaeKw5bc
November 30, 2025
158275
Iraq
IRQ
true
2
1
Claims on other sectors of the domestic economy (annual growth as % of broad money)
2016,2015,2014,2013,2012,2011,2010,2009,2008,2007,2006
Create a timeline
Public Timelines
For education
For educational institutions
For teachers
For students
Cabinet
For educational institutions
For teachers
For students
Open cabinet
FAQ
Close
Create a timeline
Public timelines
FAQ
About & Feedback
Terms
Privacy
FAQ
Support 24/7
Cabinet
Get premium
Donate
Download
Global statistics library
→
Iraq
→
Claims on other sectors of the domestic economy (annual growth as % of broad money)
This statistics in other country:
Afghanistan
Albania
Algeria
Angola
Antigua and Barbuda
Armenia
Australia
Azerbaijan
Bangladesh
Barbados
Belarus
Belize
Benin
Bhutan
Bolivia
Bosnia and Herzegovina
Botswana
Brazil
Brunei Darussalam
Bulgaria
Burkina Faso
Burundi
Cabo Verde
Cambodia
Cameroon
Canada
Central African Republic
Chad
Chile
Colombia
Comoros
Congo, Dem. Rep.
Congo, Rep.
Costa Rica
Cote d'Ivoire
Croatia
Czech Republic
Denmark
Dominica
Dominican Republic
Ecuador
Egypt, Arab Rep.
El Salvador
Equatorial Guinea
Eritrea
Estonia
Fiji
Gabon
Gambia, The
Georgia
Ghana
Grenada
Guatemala
Guinea-Bissau
Guyana
Haiti
Honduras
Hungary
Iceland
Indonesia
Iraq
Israel
Jamaica
Japan
Kazakhstan
Kenya
Korea, Rep.
Kuwait
Kyrgyz Republic
Lesotho
Macao SAR, China
Macedonia, FYR
Malaysia
Maldives
Mali
Mauritius
Mexico
Moldova
Mongolia
Morocco
Mozambique
Myanmar
Namibia
Nepal
Nicaragua
Niger
Nigeria
Norway
Oman
Pakistan
Panama
Papua New Guinea
Paraguay
Philippines
Poland
Qatar
Romania
Russian Federation
Rwanda
Samoa
Sao Tome and Principe
Senegal
Serbia
Seychelles
Sierra Leone
Slovak Republic
Solomon Islands
South Africa
South Sudan
Sri Lanka
St. Kitts and Nevis
St. Lucia
St. Vincent and the Grenadines
Sudan
Suriname
Swaziland
Sweden
Syrian Arab Republic
Tajikistan
Tanzania
Thailand
Timor-Leste
Togo
Tonga
Trinidad and Tobago
Turkey
Uganda
Ukraine
United Arab Emirates
United States
Uruguay
Vanuatu
Venezuela, RB
West Bank and Gaza
Zambia
Timeline:
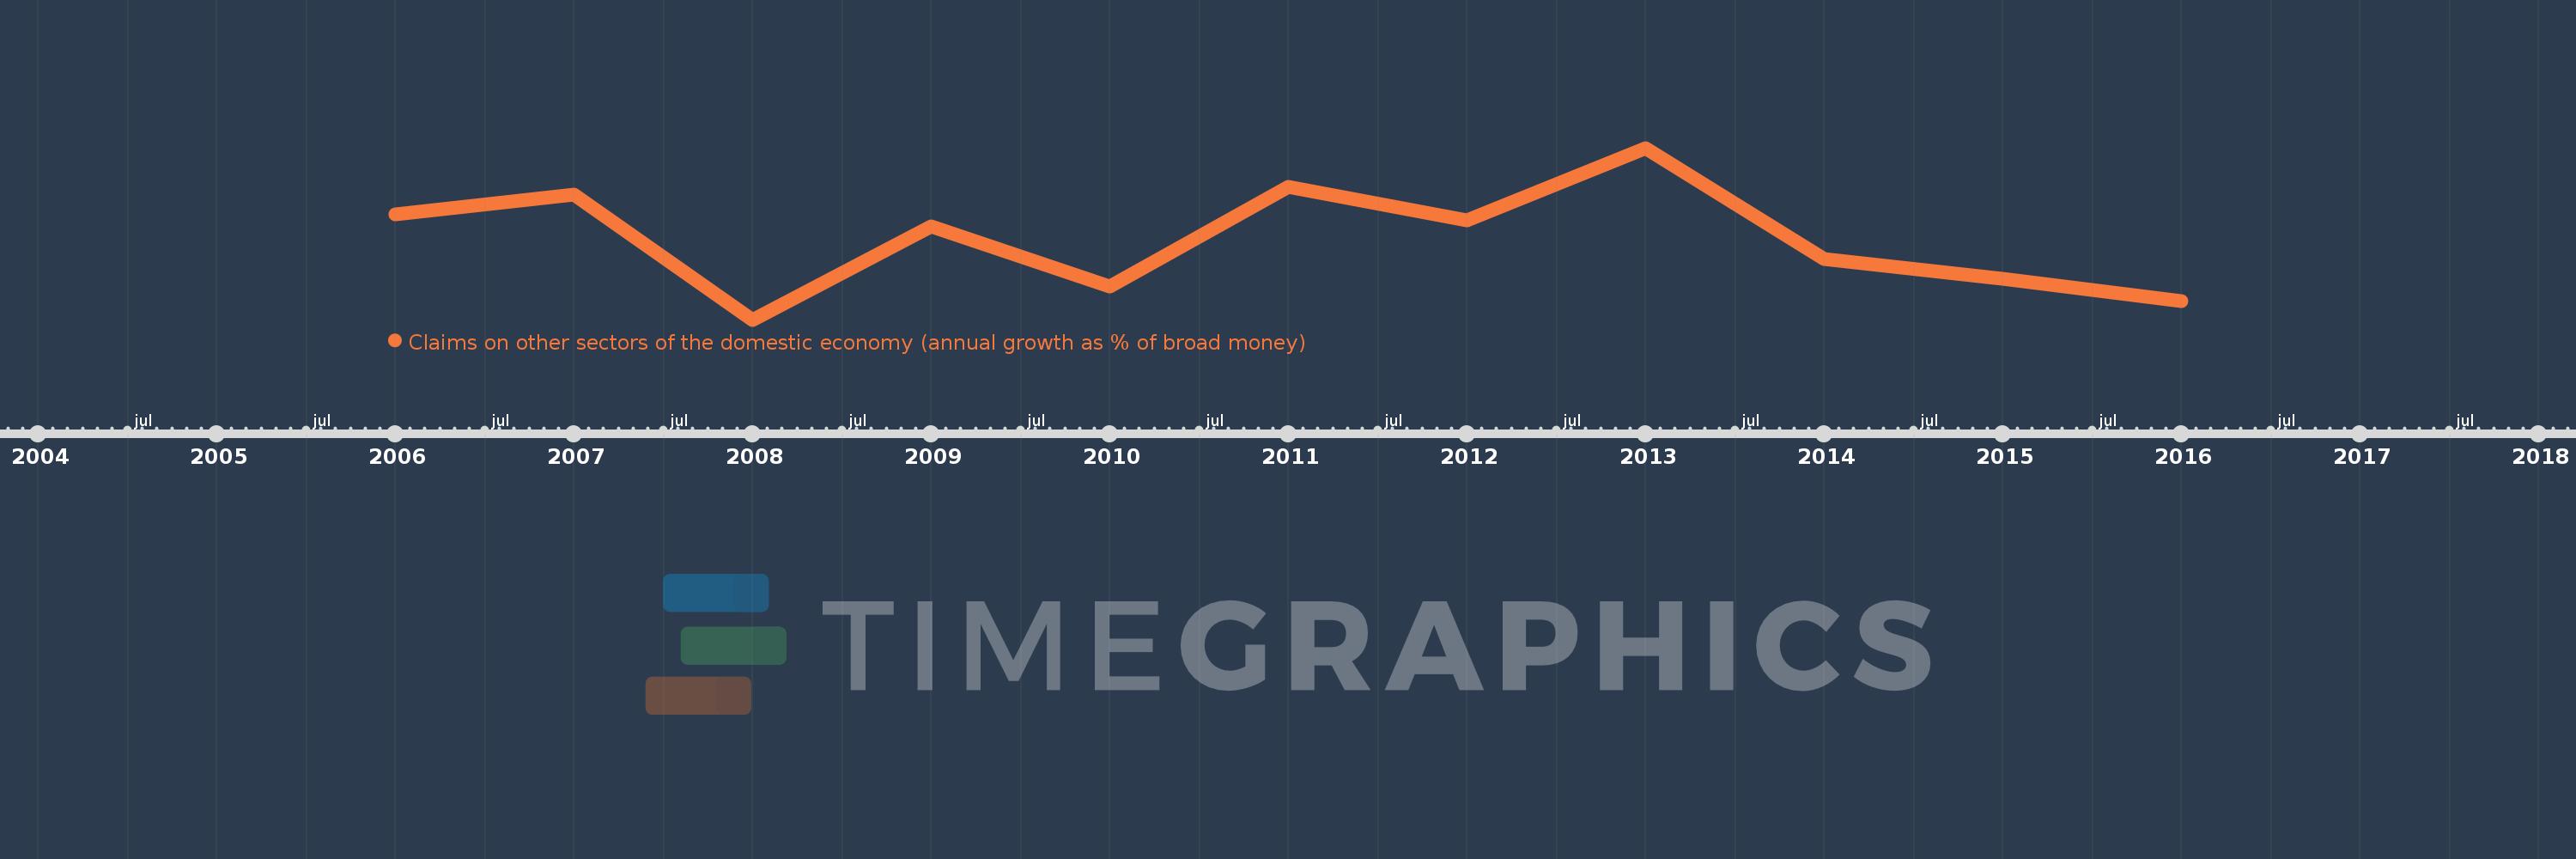
This timeline shows a graph from
2006
to
2016
of Iraq. No data until
2005
. Number of actual observations by date:
11
.
Source name:
World Development Indicators
Source organization:
International Monetary Fund, International Financial Statistics and data files.
Categories, topics:
Financial Sector
Last updated:
apr 23, 2017
Indicators value changes by year
Meaning:
4.882
Minimum:
-0.044
jan 1, 2008
Maximum:
10.515
jan 1, 2013
At the date of observation
Value
Absolute change
Change from the previous value
jan 1, 2006
6.408
+6.408
0.0%
jan 1, 2007
7.669
+1.262
19.69%
jan 1, 2008
-0.044
-7.713
-100.58%
jan 1, 2009
5.696
+5.74
-12.99K%
jan 1, 2010
1.989
-3.707
-65.09%
jan 1, 2011
8.115
+6.127
308.12%
jan 1, 2012
6.085
-2.03
-25.02%
jan 1, 2013
10.515
+4.43
72.79%
jan 1, 2014
3.705
-6.81
-64.76%
jan 1, 2015
2.463
-1.243
-33.54%
jan 1, 2016
1.106
-1.357
-55.09%
Ranking of countries by current statistics by years
About & Feedback
Terms
Privacy
FAQ
Support 24/7
Cabinet
Get premium
Donate
The service accepts bank transfer (ACH, Wire) or cards (Visa, MasterCard, etc). Processed by Stripe.
Secured with SSL