Download This statistics in other country:
Timeline:
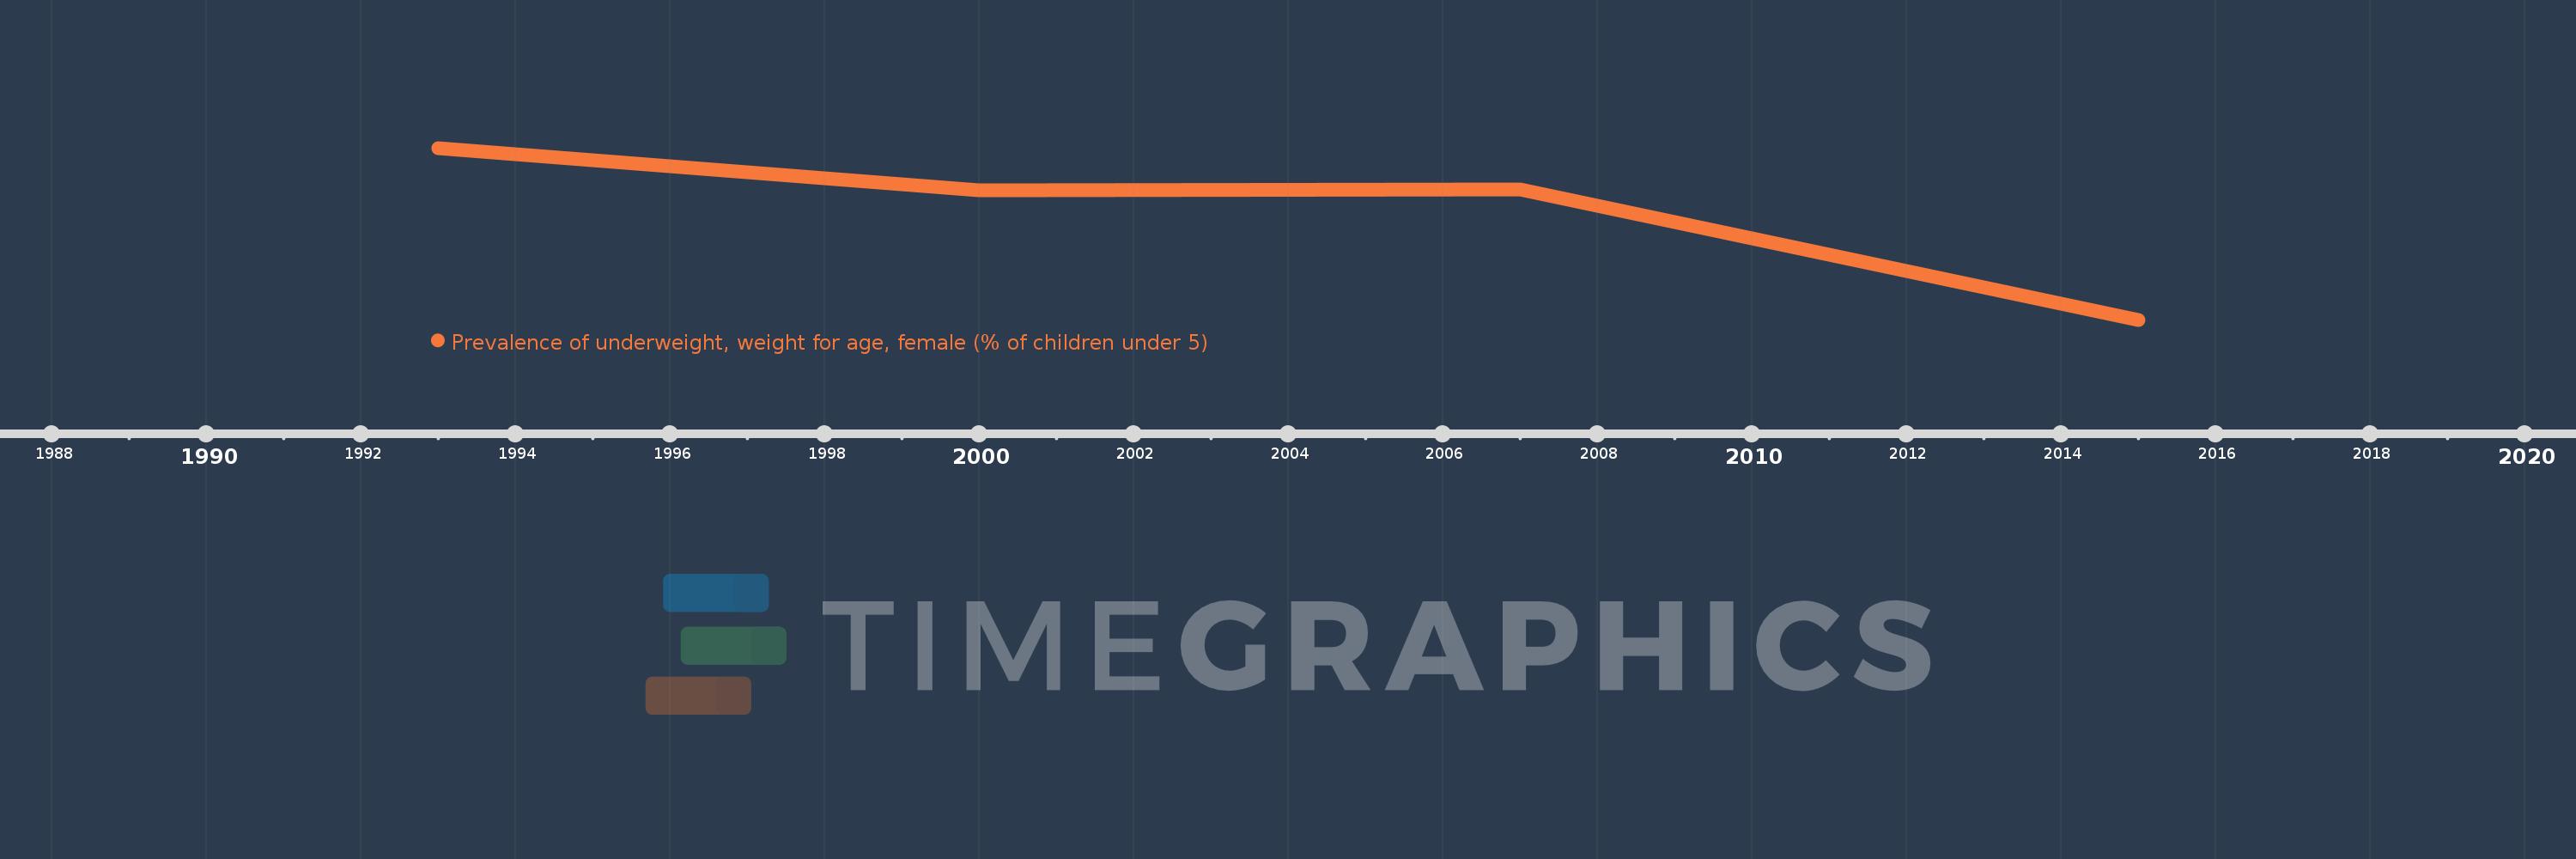
This timeline shows a graph from 1993 to 2015 of India. No data until 1992. Number of actual observations by date: 4.
Source name:
World Development Indicators
Source organization:
World Health Organization, Global Database on Child Growth and Malnutrition. Country-level data are unadjusted data from national surveys, and thus may not be comparable across countries.
Categories, topics:
Health, Gender
Last updated:
apr 23, 2017
Indicators value changes by year
At the date of observation
Value
Absolute change
Change from the previous value
jan 1, 1993
48.8
+48.8
0.0%
jan 1, 2000
43.8
-5.0
-10.25%
jan 1, 2007
43.9
+0.1
0.23%
jan 1, 2015
28.7
-15.2
-34.62%
Ranking of countries by current statistics by years