Download This statistics in other country:
Timeline:
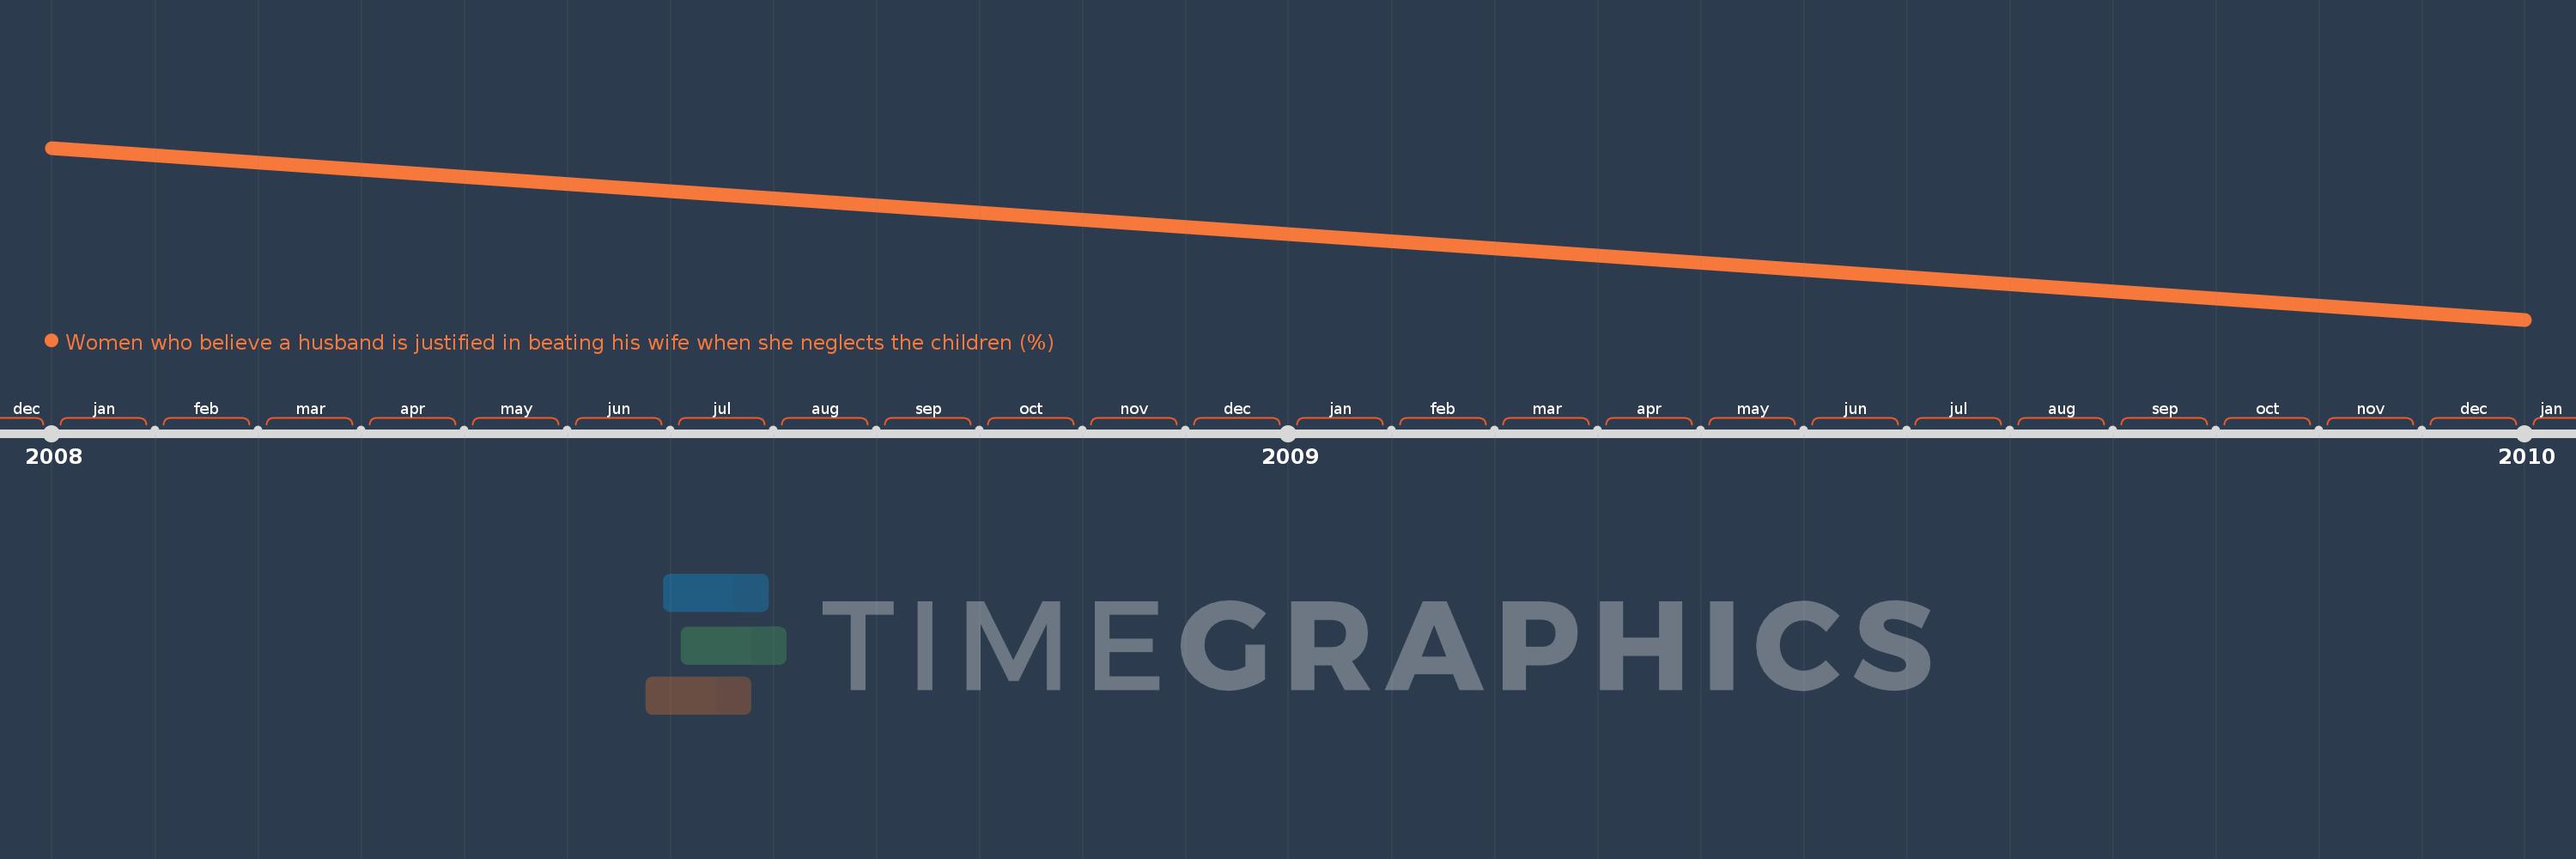
This timeline shows a graph from 2008 to 2010 of Guyana. No data until 2007. Number of actual observations by date: 2.
Source name:
World Development Indicators
Source organization:
Demographic and Health Surveys (DHS), Multiple Indicator Cluster Surveys (MICS), and other surveys: STATcompiler (http://www.statcompiler.com/) as of June 9, 2016, UNICEF global databases (http://www.data.unicef.org/) as of November 2015.
MICS Compiler (http://www.micscompiler.org/) as of June 12, 2016.
Categories, topics:
Health, Gender
Last updated:
apr 23, 2017
Indicators value changes by year
At the date of observation
Value
Absolute change
Change from the previous value
jan 1, 2008
16.6
+16.6
0.0%
jan 1, 2010
11.7
-4.9
-29.52%
Ranking of countries by current statistics by years