33
/
AIzaSyB4mHJ5NPEv-XzF7P6NDYXjlkCWaeKw5bc
November 30, 2025
147337
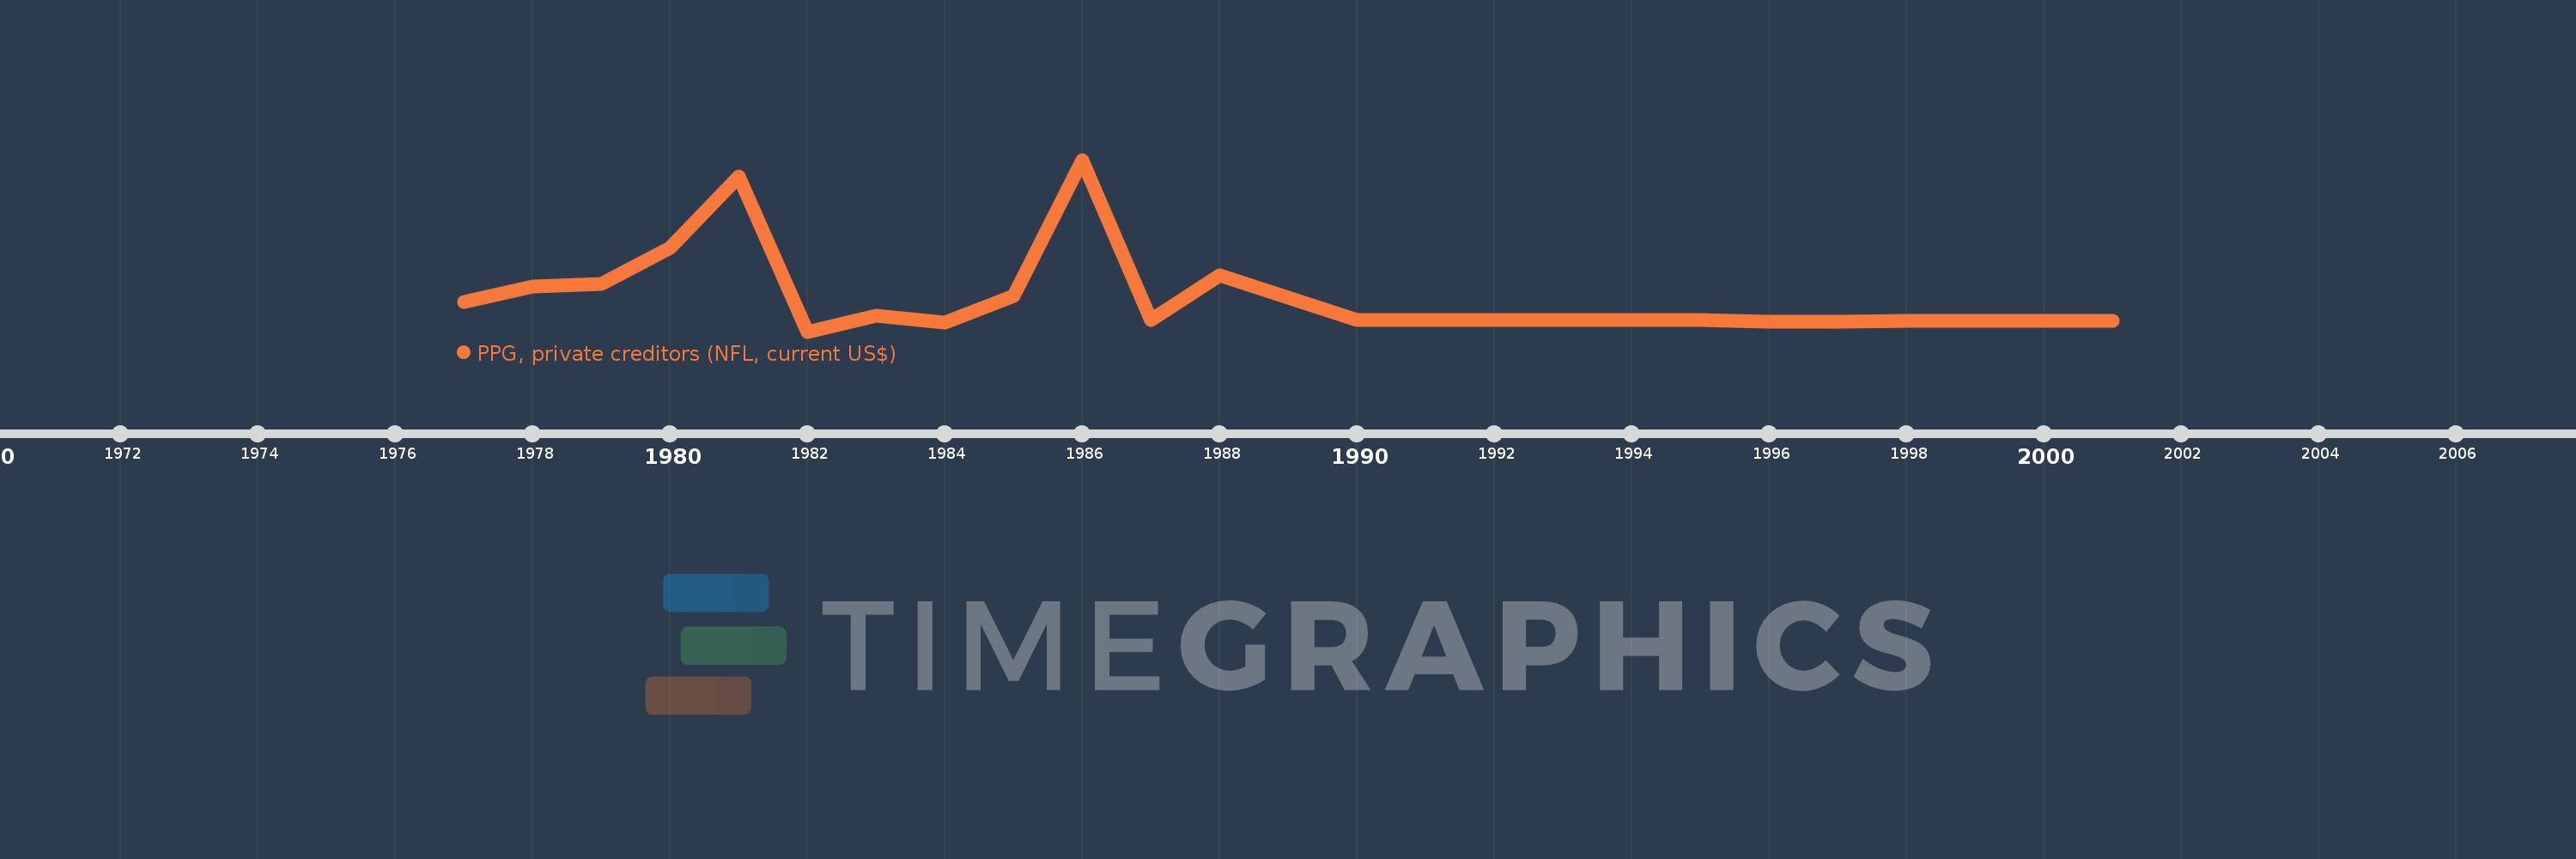
Guinea-Bissau
GNB
true
2
1
PPG, private creditors (NFL, current US$)
2001,2000,1999,1998,1997,1996,1995,1993,1992,1991,1990,1988,1987,1986,1985,1984,1983,1982,1981,1980,1979,1978,1977