33
/
AIzaSyB4mHJ5NPEv-XzF7P6NDYXjlkCWaeKw5bc
November 30, 2025
144099
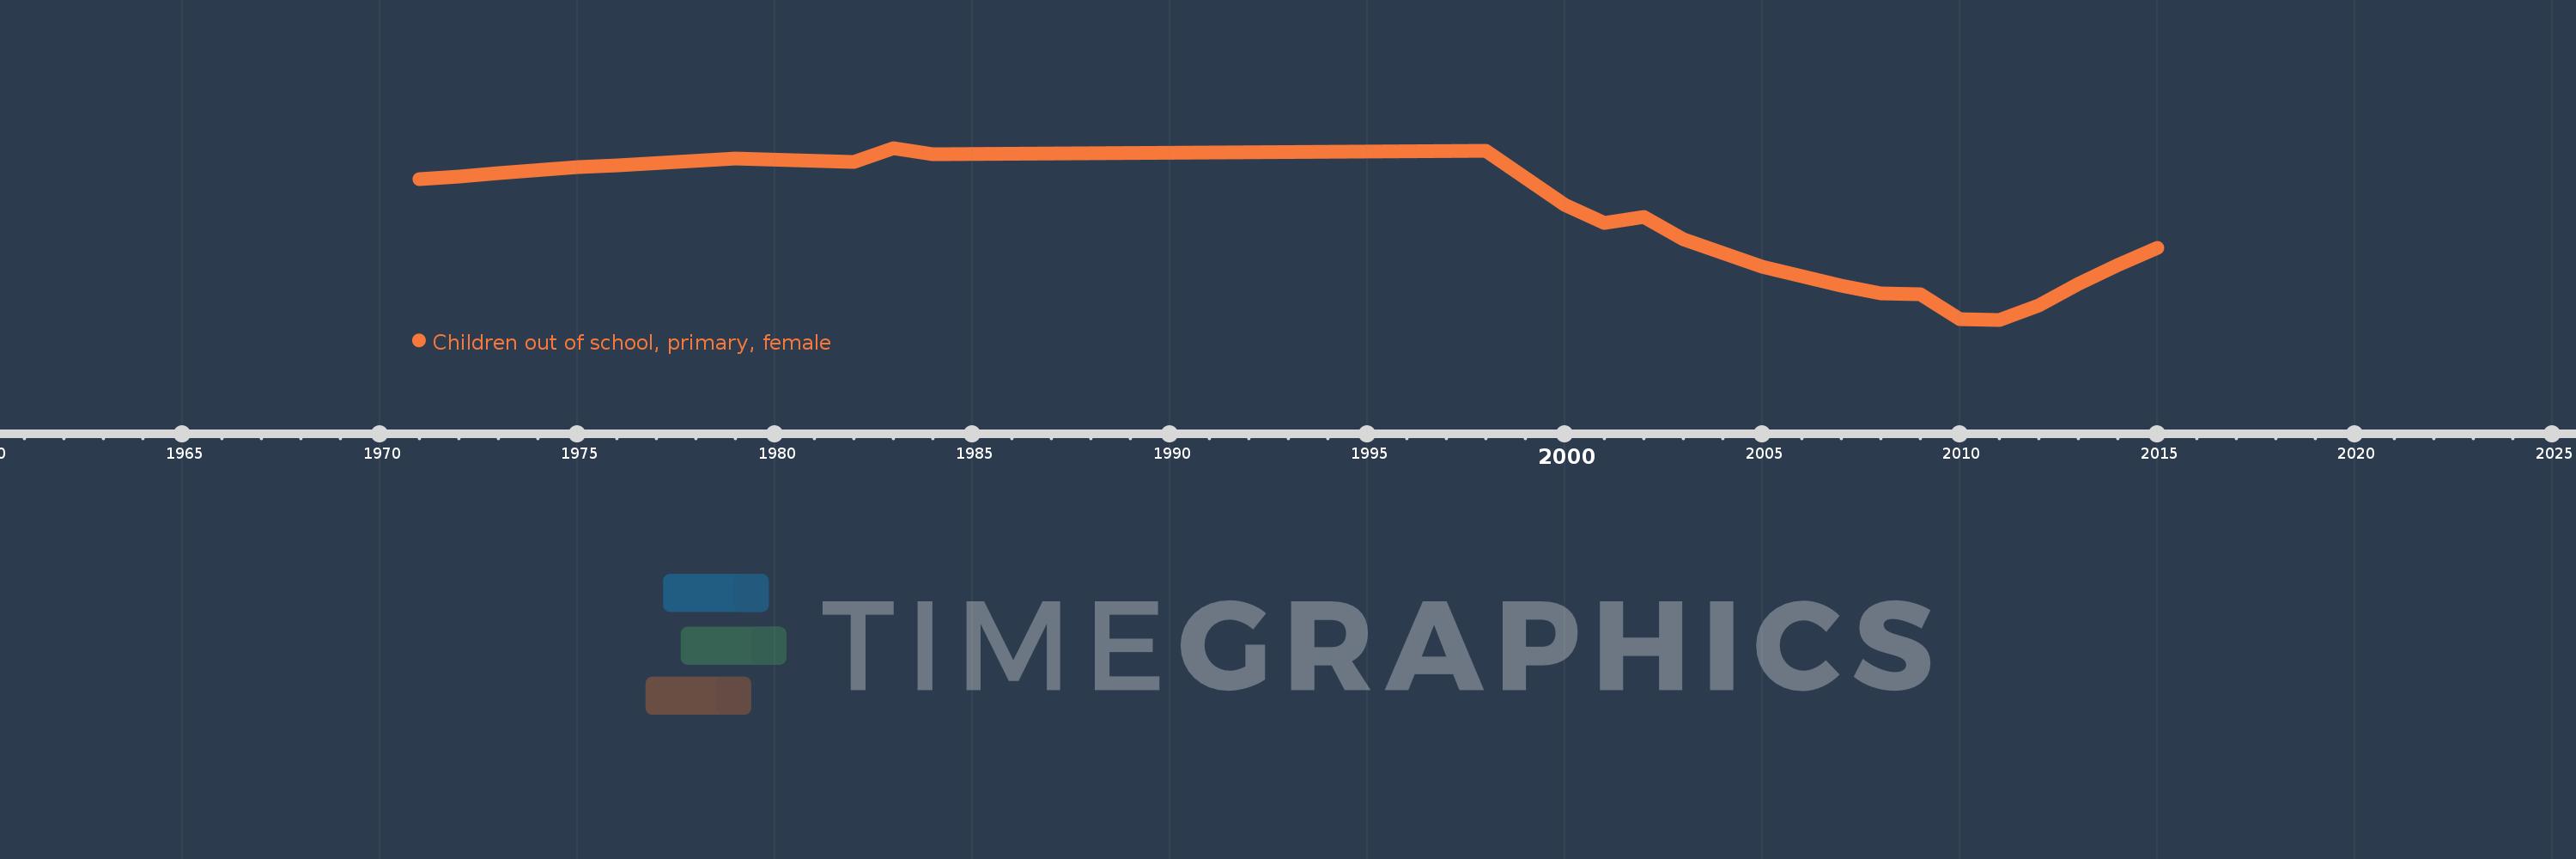
Guatemala
GTM
true
2
1
Children out of school, primary, female
2015,2014,2013,2012,2011,2010,2009,2008,2007,2006,2005,2003,2002,2001,2000,1998,1984,1983,1982,1979,1976,1975,1973,1972,1971