29
/
en
AIzaSyAYiBZKx7MnpbEhh9jyipgxe19OcubqV5w
April 1, 2024
144064
Guatemala
GTM
true
2
1
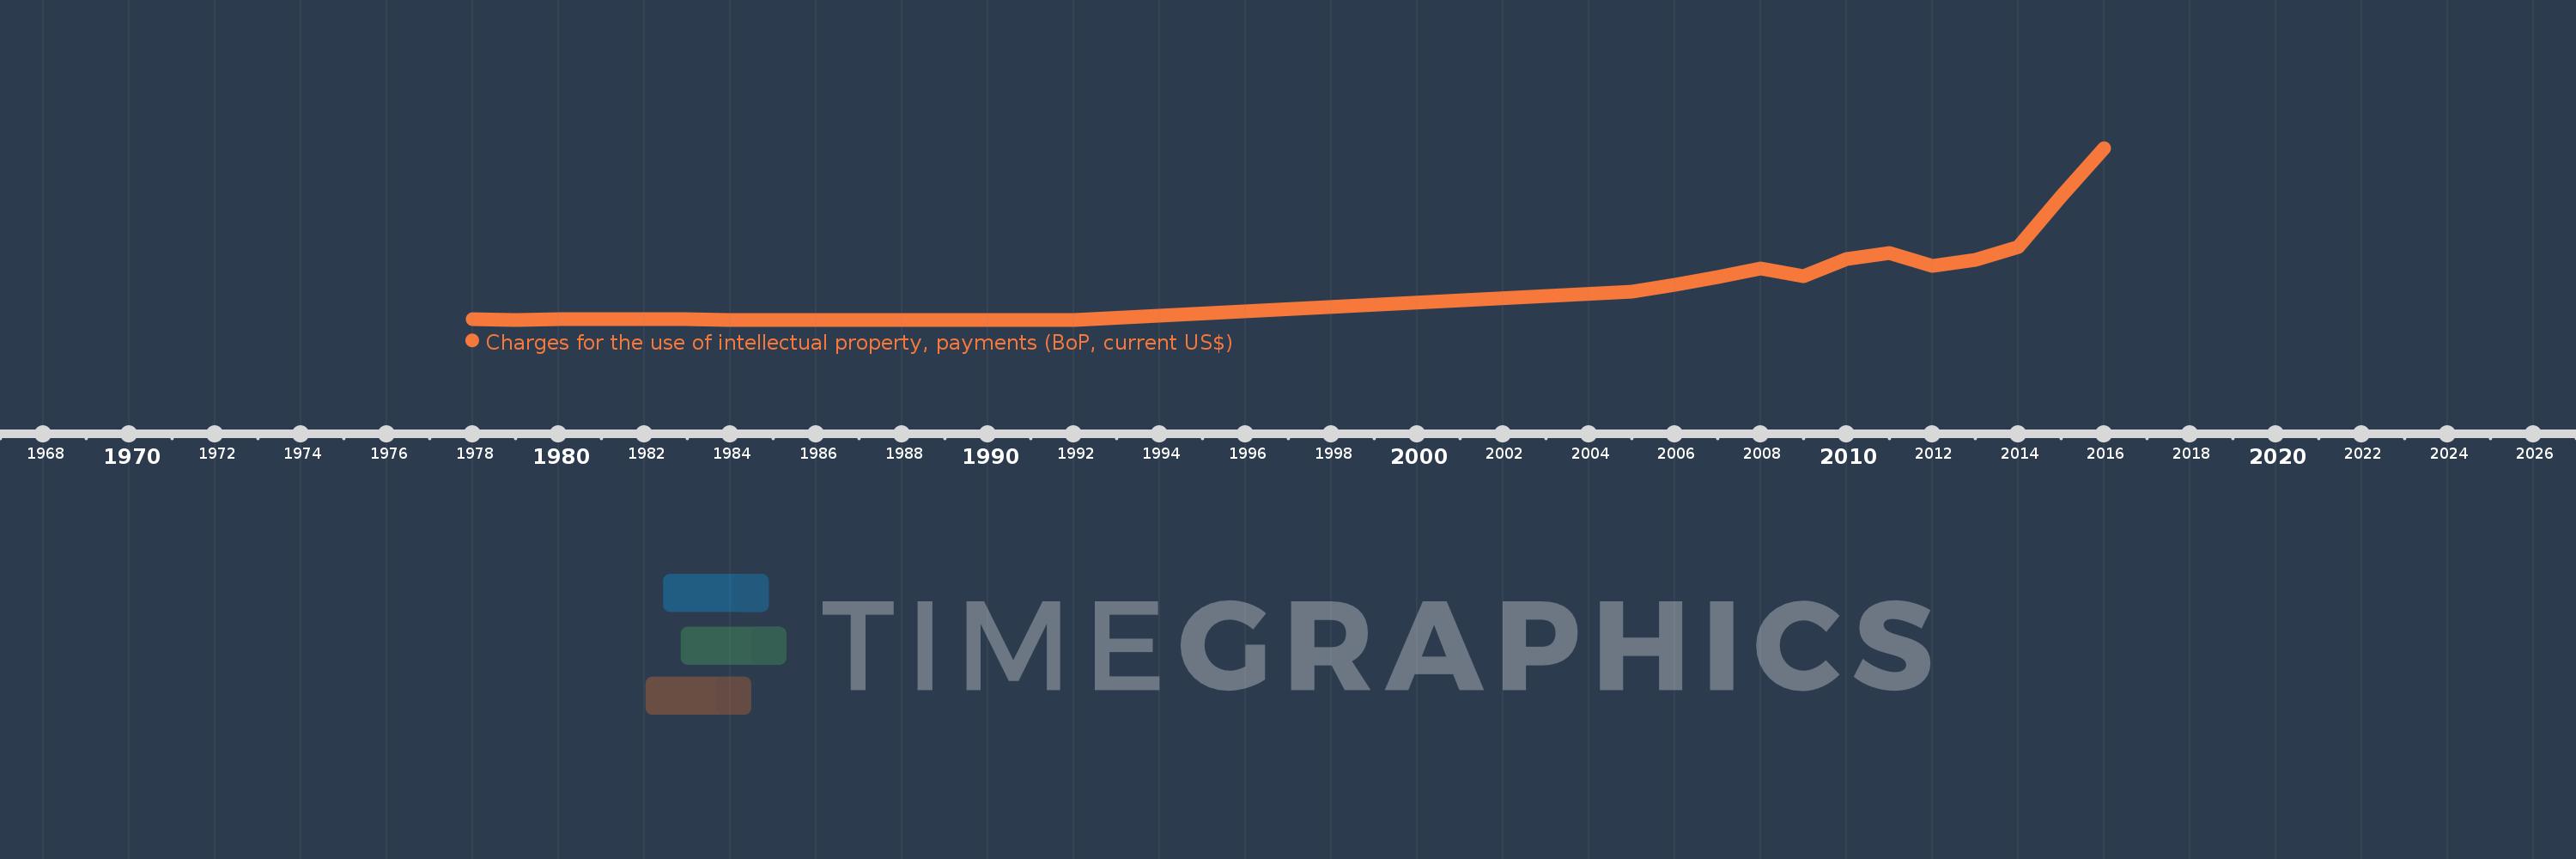
Charges for the use of intellectual property, payments (BoP, current US$)
2016,2015,2014,2013,2012,2011,2010,2009,2008,2007,2006,2005,1992,1987,1985,1984,1983,1982,1981,1980,1979,1978
This statistics in other country:
Timeline:
This timeline shows a graph from 1978 to 2016 of Guatemala. No data until 1977. Number of actual observations by date: 22.
Source name:
World Development Indicators
Source organization:
International Monetary Fund, Balance of Payments Statistics Yearbook and data files.
Categories, topics:
Economy & Growth, Science & Technology
Last updated:
apr 23, 2017
Indicators value changes by year
Minimum:
100.0K
jan 1, 1987
Maximum:
243.253 mln
jan 1, 2016
At the date of observation
Value
Absolute change
Change from previous value
jan 1, 1978
1.2 mln
+1.2 mln
0.0%
jan 1, 1979
300.0K
-900.0K
-75.0%
jan 1, 1980
600.0K
+300.0K
100.0%
jan 1, 1981
1.3 mln
+700.0K
116.67%
jan 1, 1982
600.0K
-700.0K
-53.85%
jan 1, 1983
400.0K
-200.0K
-33.33%
jan 1, 1984
300.0K
-100.0K
-25.0%
jan 1, 1985
200.0K
-100.0K
-33.33%
jan 1, 1987
100.0K
-100.0K
-50.0%
jan 1, 1992
100.0K
0.0
0.0%
jan 1, 2005
39.9 mln
+39.8 mln
39.8K%
jan 1, 2006
49.4 mln
+9.5 mln
23.81%
jan 1, 2007
60.2 mln
+10.8 mln
21.86%
jan 1, 2008
72.1 mln
+11.9 mln
19.77%
jan 1, 2009
62.147 mln
-9.953 mln
-13.8%
jan 1, 2010
86.198 mln
+24.05 mln
38.7%
jan 1, 2011
93.975 mln
+7.777 mln
9.02%
jan 1, 2012
76.349 mln
-17.626 mln
-18.76%
jan 1, 2013
84.246 mln
+7.898 mln
10.34%
jan 1, 2014
103.204 mln
+18.957 mln
22.5%
jan 1, 2015
175.215 mln
+72.011 mln
69.78%
jan 1, 2016
243.253 mln
+68.038 mln
38.83%
Ranking of countries by current statistics by years
Comments: