33
/
AIzaSyB4mHJ5NPEv-XzF7P6NDYXjlkCWaeKw5bc
November 30, 2025
138562
Georgia
GEO
true
2
1
PPG, bilateral (TDS, current US$)
2016,2015,2014,2013,2012,2011,2010,2009,2008,2007,2006,2005,2004,2003,2002,2001,2000,1999,1998,1997,1996
Create a timeline
Public Timelines
For education
For educational institutions
For teachers
For students
Cabinet
For educational institutions
For teachers
For students
Open cabinet
FAQ
Close
Create a timeline
Public timelines
FAQ
About & Feedback
Terms
Privacy
FAQ
Support 24/7
Cabinet
Get premium
Donate
Download
Global statistics library
→
Georgia
→
PPG, bilateral (TDS, current US$)
This statistics in other country:
Afghanistan
Albania
Algeria
Angola
Argentina
Armenia
Azerbaijan
Bangladesh
Belarus
Belize
Benin
Bhutan
Bolivia
Bosnia and Herzegovina
Botswana
Brazil
Bulgaria
Burkina Faso
Burundi
Cabo Verde
Cambodia
Cameroon
Central African Republic
Chad
China
Colombia
Comoros
Congo, Dem. Rep.
Congo, Rep.
Costa Rica
Cote d'Ivoire
Djibouti
Dominica
Dominican Republic
East Asia & Pacific (excluding high income)
Ecuador
Egypt, Arab Rep.
El Salvador
Eritrea
Ethiopia
Europe & Central Asia (excluding high income)
Fiji
Gabon
Gambia, The
Georgia
Ghana
Grenada
Guatemala
Guinea
Guinea-Bissau
Guyana
Haiti
Honduras
IDA only
India
Indonesia
Iran, Islamic Rep.
Jamaica
Jordan
Kazakhstan
Kenya
Kosovo
Kyrgyz Republic
Lao PDR
Latin America & Caribbean (excluding high income)
Lebanon
Lesotho
Liberia
Low & middle income
Low income
Lower middle income
Macedonia, FYR
Madagascar
Malawi
Malaysia
Maldives
Mali
Mauritania
Mauritius
Mexico
Middle East & North Africa (excluding high income)
Middle income
Moldova
Mongolia
Montenegro
Morocco
Mozambique
Myanmar
Nepal
Nicaragua
Niger
Nigeria
Pakistan
Panama
Papua New Guinea
Paraguay
Peru
Philippines
Romania
Russian Federation
Rwanda
Samoa
Sao Tome and Principe
Senegal
Serbia
Sierra Leone
Solomon Islands
Somalia
South Asia
Sri Lanka
St. Lucia
St. Vincent and the Grenadines
Sub-Saharan Africa (excluding high income)
Sudan
Swaziland
Syrian Arab Republic
Tajikistan
Tanzania
Thailand
Togo
Tonga
Tunisia
Turkey
Turkmenistan
Uganda
Ukraine
Upper middle income
Uzbekistan
Vanuatu
Venezuela, RB
Vietnam
Yemen, Rep.
Zambia
Zimbabwe
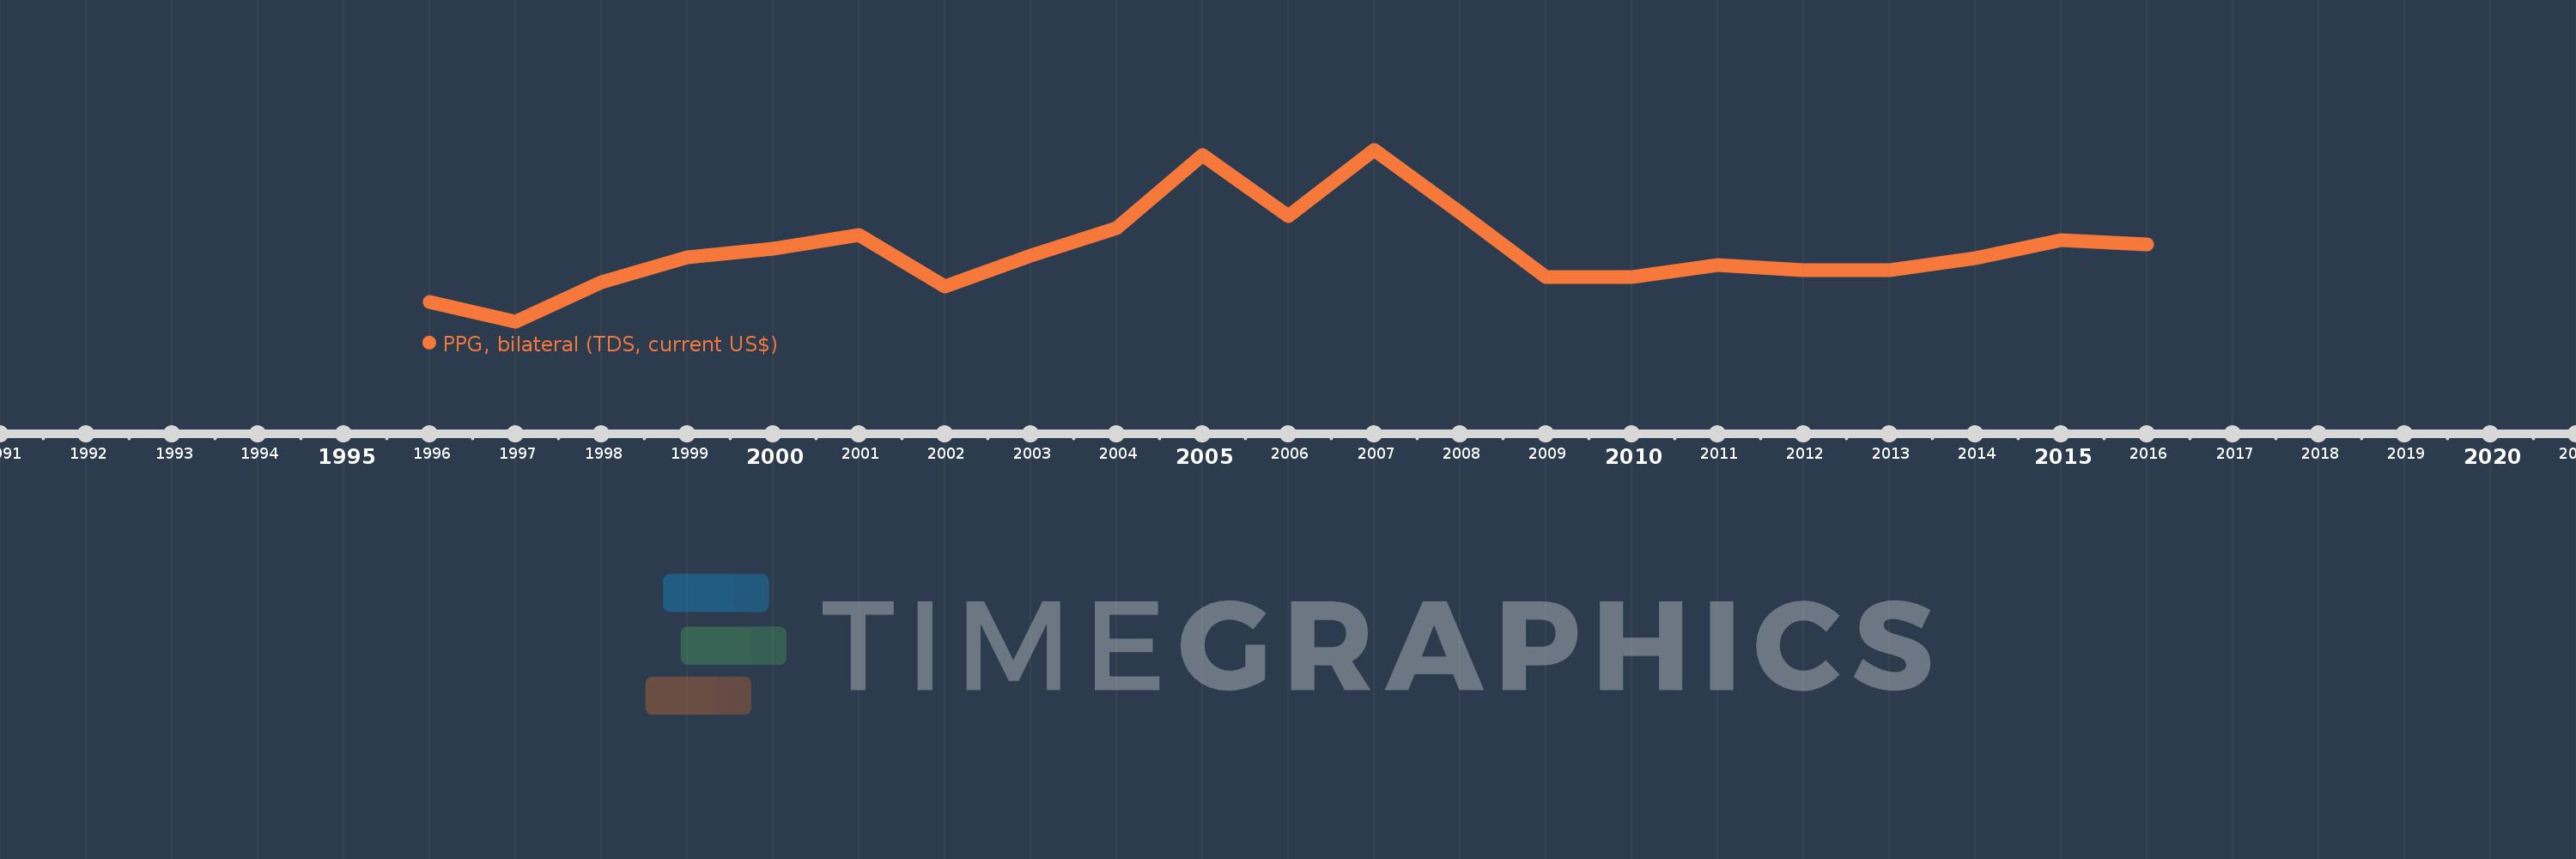
Timeline:
This timeline shows a graph from
1996
to
2016
of Georgia. No data until
1995
. Number of actual observations by date:
21
.
Source name:
World Development Indicators
Source organization:
World Bank, International Debt Statistics.
Categories, topics:
External Debt
Last updated:
apr 23, 2017
Indicators value changes by year
Meaning:
56.958 mln
Minimum:
1.588 mln
jan 1, 1997
Maximum:
134.133 mln
jan 1, 2007
At the date of observation
Value
Absolute change
Change from the previous value
jan 1, 1996
17.149 mln
+17.149 mln
0.0%
jan 1, 1997
1.588 mln
-15.561 mln
-90.74%
jan 1, 1998
31.977 mln
+30.389 mln
1.91K%
jan 1, 1999
51.617 mln
+19.64 mln
61.42%
jan 1, 2000
58.274 mln
+6.657 mln
12.9%
jan 1, 2001
68.856 mln
+10.582 mln
18.16%
jan 1, 2002
28.875 mln
-39.981 mln
-58.06%
jan 1, 2003
52.566 mln
+23.691 mln
82.05%
jan 1, 2004
74.101 mln
+21.535 mln
40.97%
jan 1, 2005
130.209 mln
+56.108 mln
75.72%
jan 1, 2006
83.123 mln
-47.086 mln
-36.16%
jan 1, 2007
134.133 mln
+51.01 mln
61.37%
jan 1, 2008
85.823 mln
-48.31 mln
-36.02%
jan 1, 2009
35.925 mln
-49.898 mln
-58.14%
jan 1, 2010
36.544 mln
+619.0K
1.72%
jan 1, 2011
45.576 mln
+9.032 mln
24.72%
jan 1, 2012
41.468 mln
-4.108 mln
-9.01%
jan 1, 2013
41.385 mln
-83.0K
-0.2%
jan 1, 2014
50.857 mln
+9.472 mln
22.89%
jan 1, 2015
64.706 mln
+13.849 mln
27.23%
jan 1, 2016
61.362 mln
-3.344 mln
-5.17%
Ranking of countries by current statistics by years
About & Feedback
Terms
Privacy
FAQ
Support 24/7
Cabinet
Get premium
Donate
The service accepts bank transfer (ACH, Wire) or cards (Visa, MasterCard, etc). Processed by Stripe.
Secured with SSL