Download This statistics in other country:
Timeline:
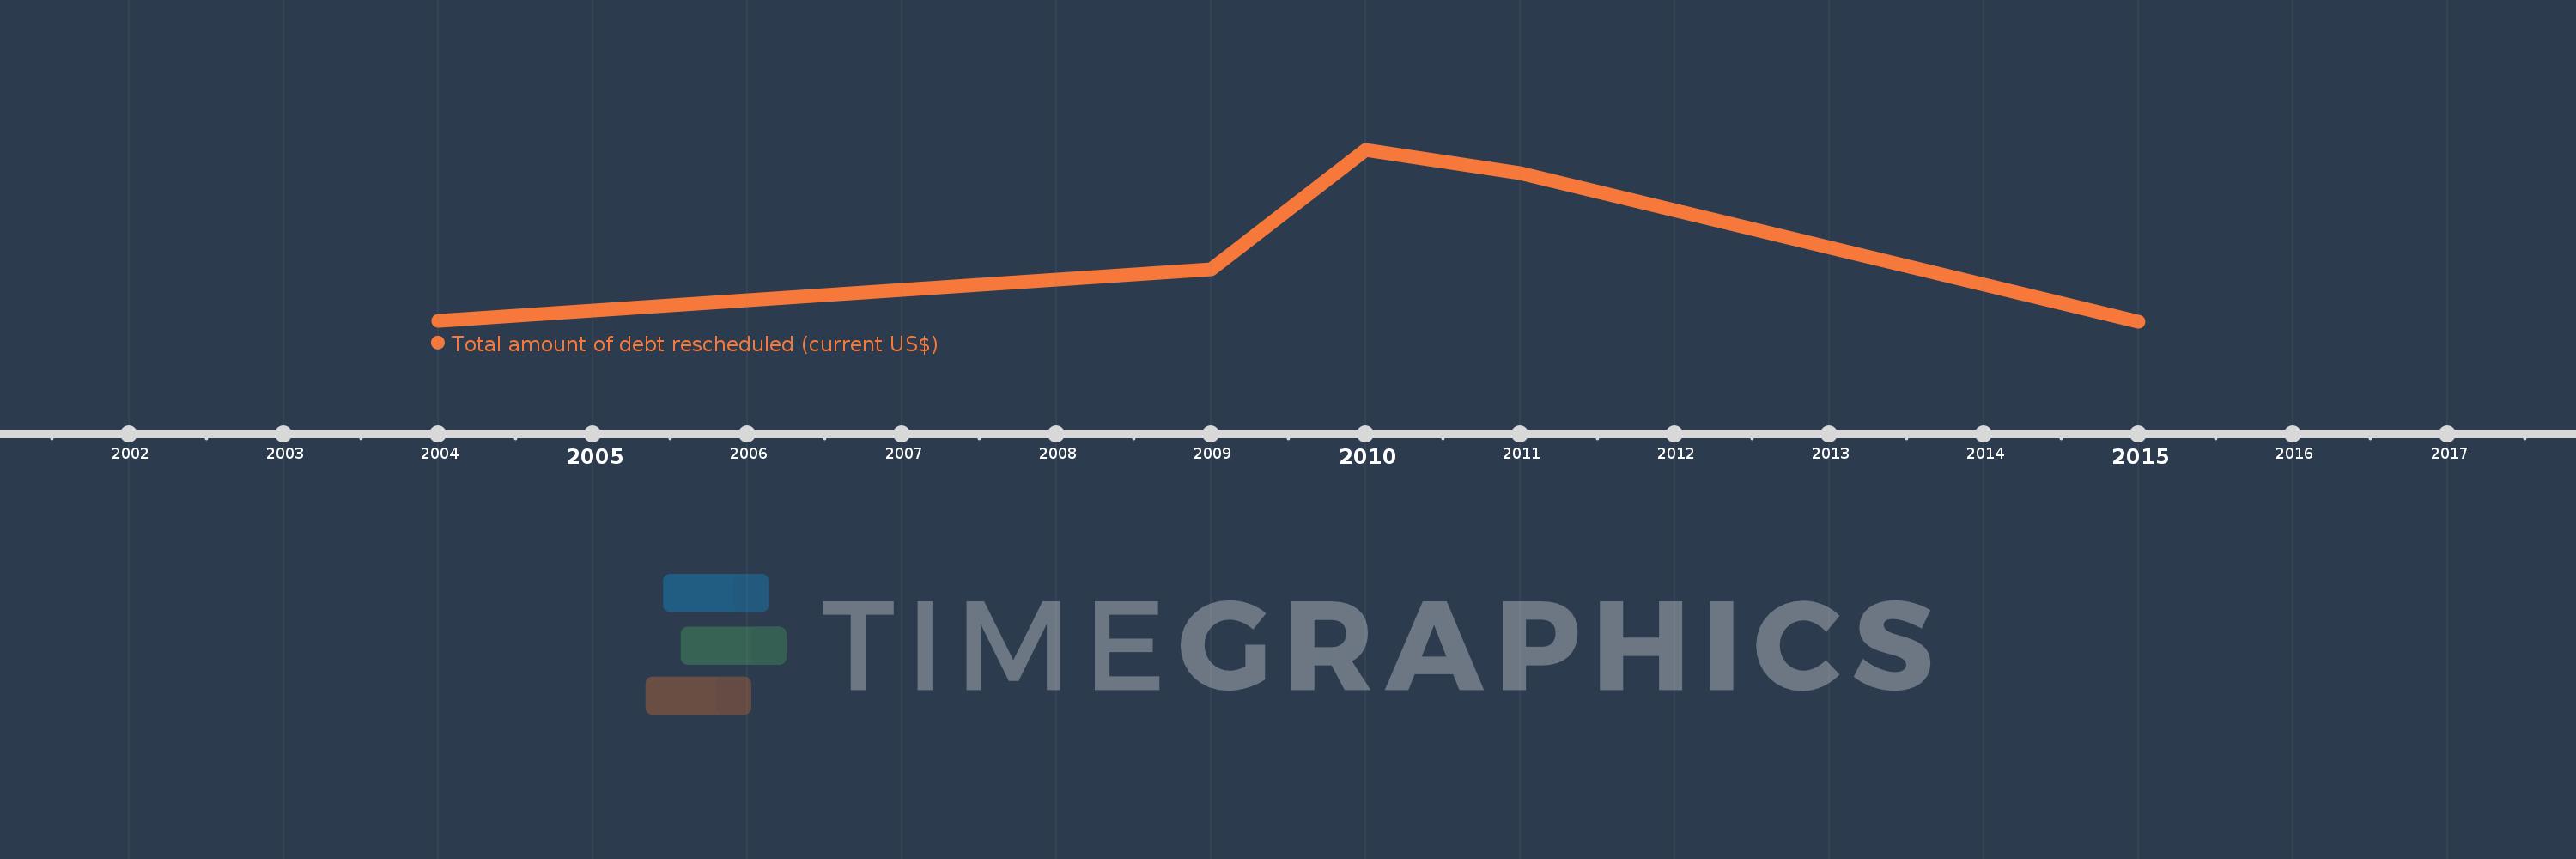
This timeline shows a graph from 2004 to 2015 of Gambia, The. No data until 2003. Number of actual observations by date: 5.
Source name:
World Development Indicators
Source organization:
World Bank, International Debt Statistics.
Categories, topics:
External Debt
Last updated:
apr 23, 2017
Indicators value changes by year
Maximum:
23.976 mln
jan 1, 2010
At the date of observation
Value
Absolute change
Change from the previous value
jan 1, 2004
147.0K
+147.0K
0.0%
jan 1, 2009
7.36 mln
+7.213 mln
4.91K%
jan 1, 2010
23.976 mln
+16.616 mln
225.76%
jan 1, 2011
20.776 mln
-3.2 mln
-13.35%
jan 1, 2015
0.0
-20.776 mln
-100.0%
Ranking of countries by current statistics by years