33
/
AIzaSyB4mHJ5NPEv-XzF7P6NDYXjlkCWaeKw5bc
November 30, 2025
134571
France
FRA
true
2
1
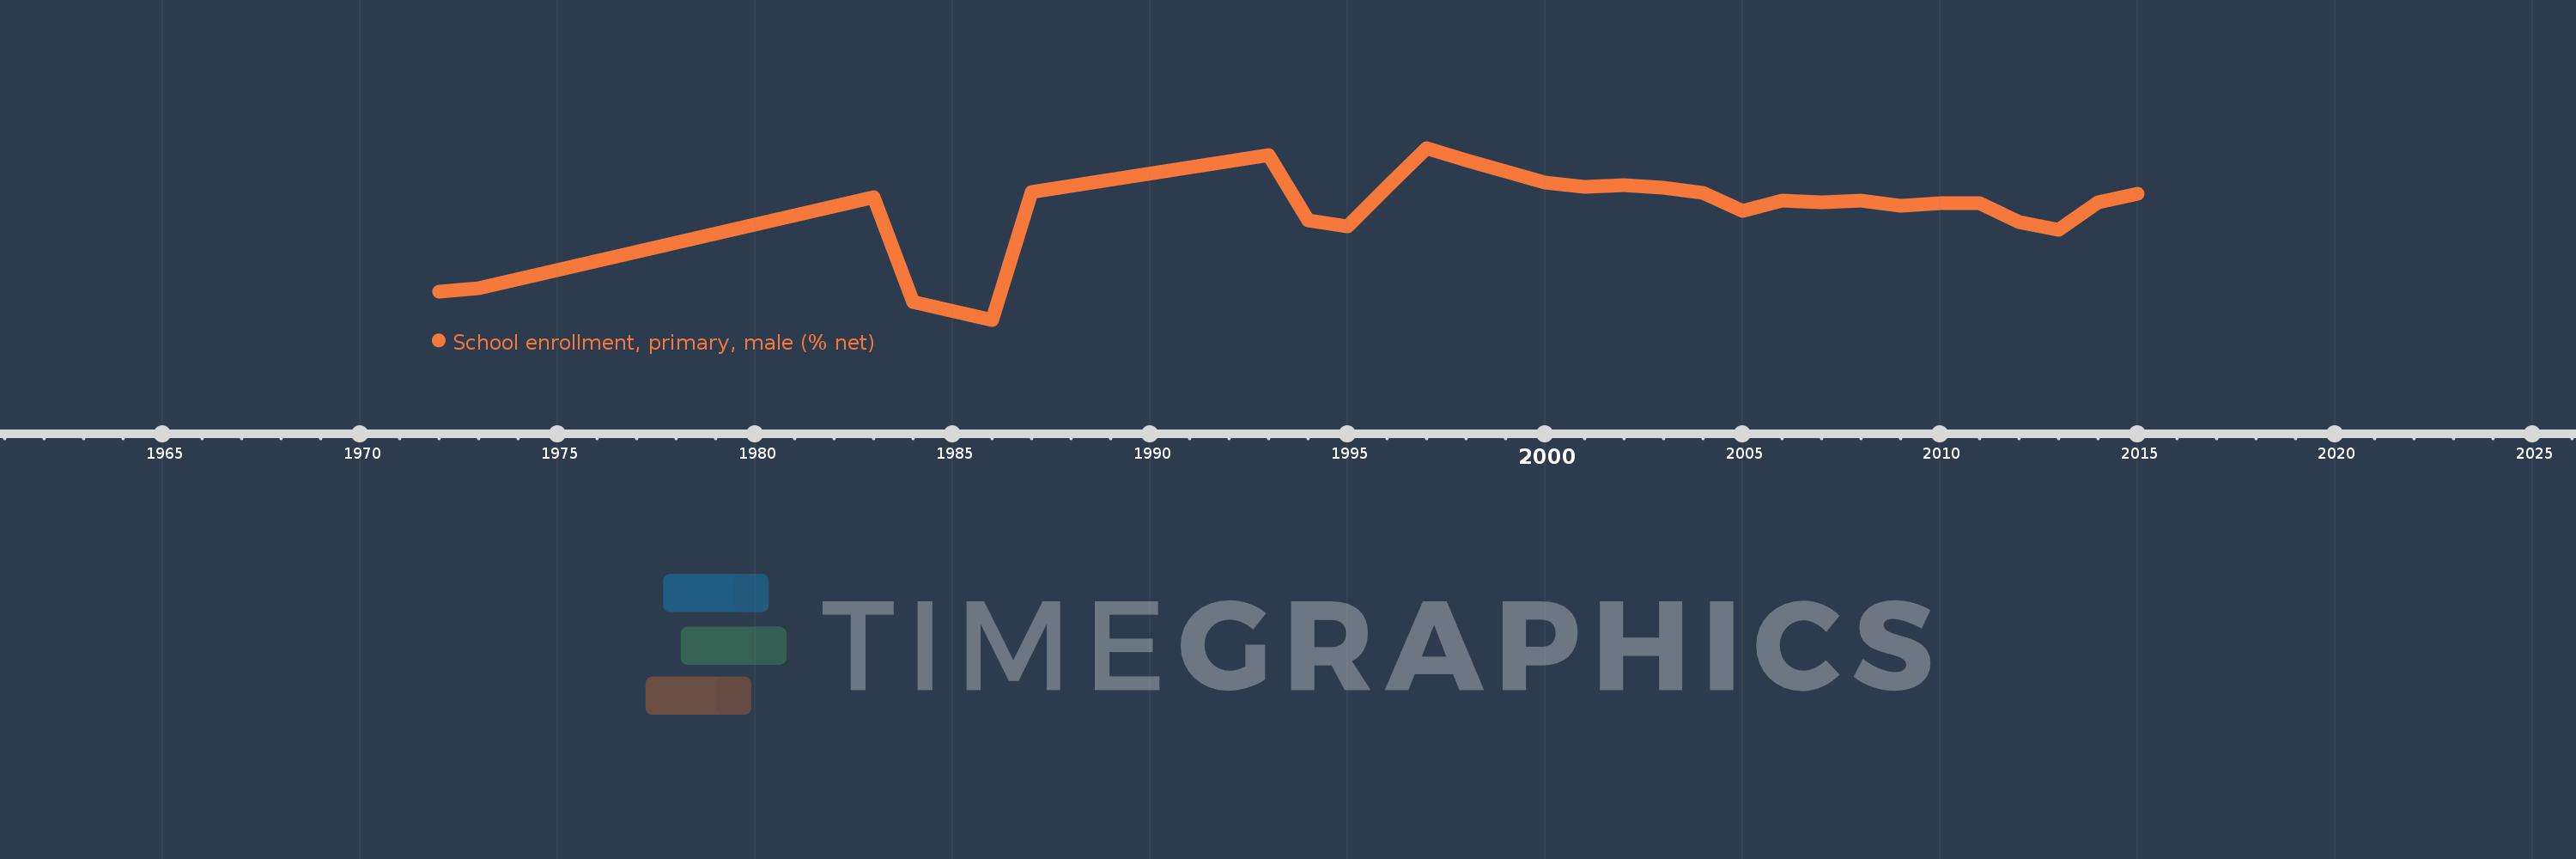
School enrollment, primary, male (% net)
2015,2014,2013,2012,2011,2010,2009,2008,2007,2006,2005,2004,2003,2002,2001,2000,1998,1997,1996,1995,1994,1993,1987,1986,1984,1983,1973,1972