33
/
AIzaSyB4mHJ5NPEv-XzF7P6NDYXjlkCWaeKw5bc
November 30, 2025
131118
Ethiopia
ETH
true
2
1
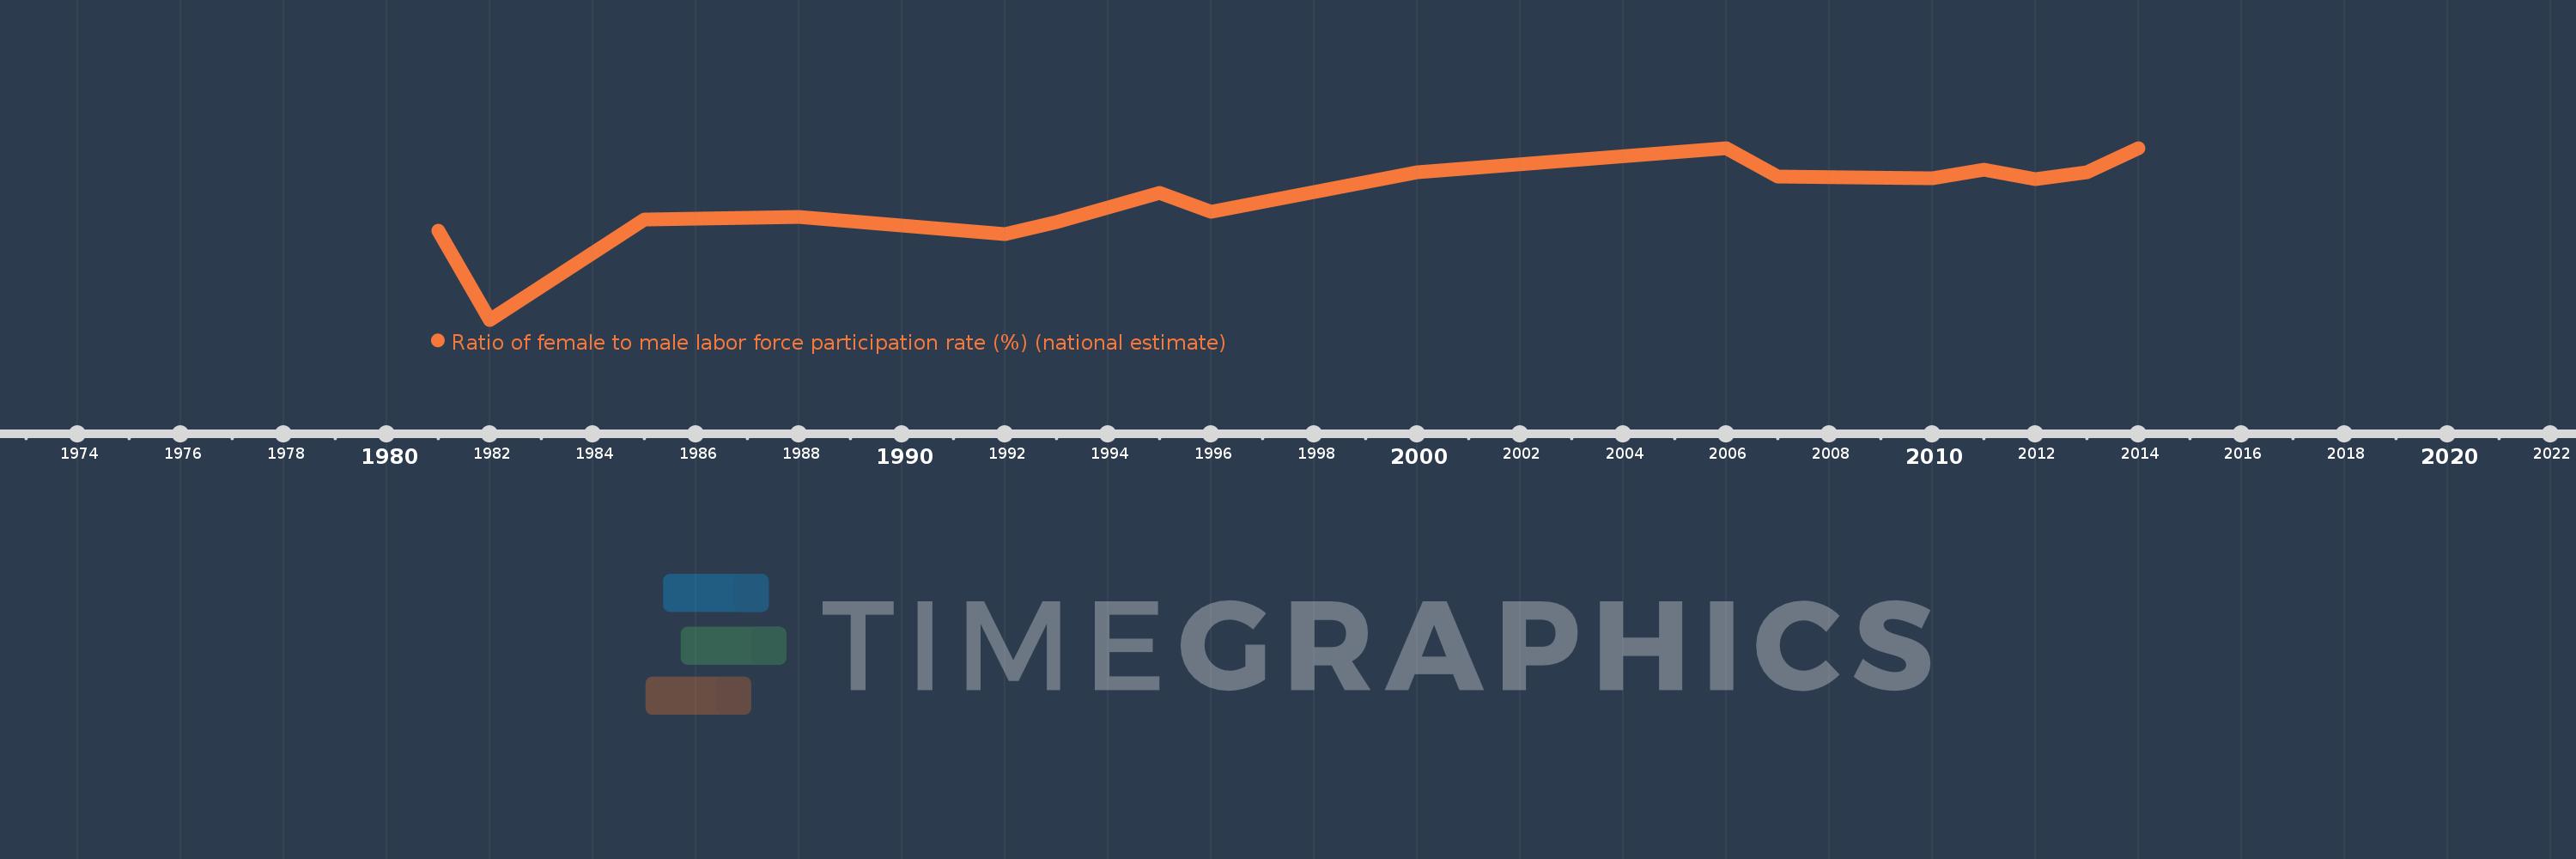
Ratio of female to male labor force participation rate (%) (national estimate)
2014,2013,2012,2011,2010,2007,2006,2000,1996,1995,1993,1992,1988,1985,1982,1981