Download This statistics in other country:
AfghanistanAlbaniaAlgeriaAngolaAntigua and BarbudaArgentinaArmeniaArubaAustraliaAustriaAzerbaijanBahamas, TheBahrainBangladeshBarbadosBelarusBelgiumBelizeBeninBermudaBhutanBoliviaBosnia and HerzegovinaBotswanaBrazilBrunei DarussalamBulgariaBurkina FasoBurundiCabo VerdeCambodiaCameroonCanadaCentral African RepublicChadChileChinaColombiaComorosCongo, Dem. Rep.Congo, Rep.Costa RicaCote d'IvoireCroatiaCubaCyprusCzech RepublicDenmarkDjiboutiDominicaDominican RepublicEcuadorEgypt, Arab Rep.El SalvadorEquatorial GuineaEritreaEstoniaEthiopiaFaroe IslandsFijiFinlandFranceFrench PolynesiaGabonGambia, TheGeorgiaGermanyGhanaGreeceGrenadaGuatemalaGuineaGuinea-BissauGuyanaHaitiHondurasHong Kong SAR, ChinaHungaryIcelandIndiaIndonesiaIran, Islamic Rep.IraqIrelandIsraelItalyJamaicaJapanJordanKazakhstanKenyaKiribatiKorea, Rep.KosovoKuwaitKyrgyz RepublicLao PDRLatviaLebanonLesothoLiberiaLibyaLithuaniaLuxembourgMacao SAR, ChinaMacedonia, FYRMadagascarMalawiMalaysiaMaldivesMaliMaltaMauritaniaMauritiusMexicoMicronesia, Fed. Sts.MoldovaMongoliaMontenegroMoroccoMozambiqueNamibiaNepalNetherlandsNew CaledoniaNew ZealandNicaraguaNigerNigeriaNorwayOmanPakistanPanamaPapua New GuineaParaguayPeruPhilippinesPolandPortugalPuerto RicoQatarRomaniaRussian FederationRwandaSaudi ArabiaSenegalSerbiaSeychellesSierra LeoneSingaporeSlovak RepublicSloveniaSolomon IslandsSomaliaSouth AfricaSouth SudanSpainSri LankaSt. Kitts and NevisSt. LuciaSt. Vincent and the GrenadinesSudanSurinameSwazilandSwedenSwitzerlandSyrian Arab RepublicTajikistanTanzaniaThailandTimor-LesteTogoTongaTrinidad and TobagoTunisiaTurkeyTurkmenistanUgandaUkraineUnited Arab EmiratesUnited KingdomUnited StatesUruguayUzbekistanVanuatuVenezuela, RBVietnamWest Bank and GazaYemen, Rep.ZambiaZimbabwe Timeline:
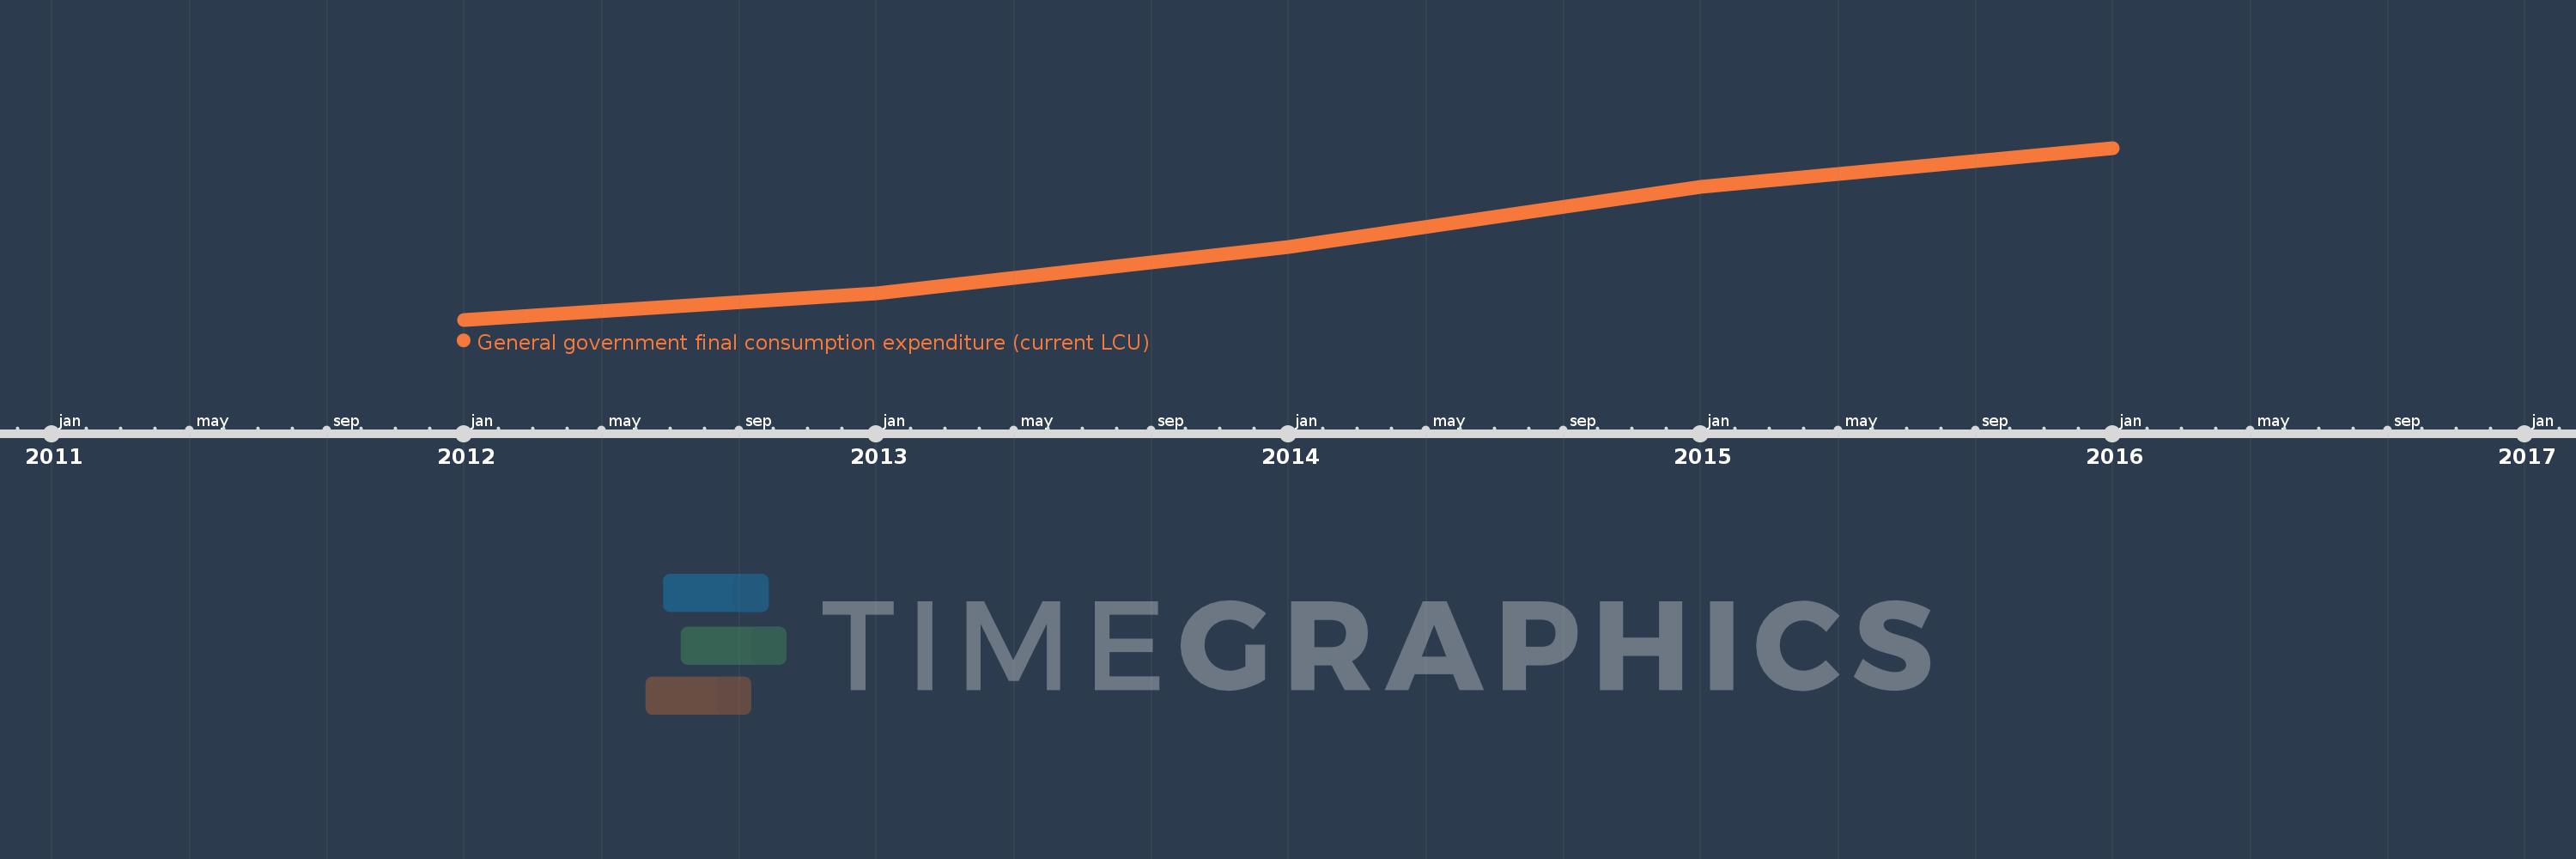
This timeline shows a graph from 2012 to 2016 of Ethiopia. No data until 2011. Number of actual observations by date: 5.
Source name:
World Development Indicators
Source organization:
World Bank national accounts data, and OECD National Accounts data files.
Categories, topics:
Economy & Growth
Last updated:
apr 23, 2017
Indicators value changes by year
Minimum:
53.147 bln
jan 1, 2012
Maximum:
111.301 bln
jan 1, 2016
At the date of observation
Value
Absolute change
Change from the previous value
jan 1, 2012
53.147 bln
+53.147 bln
0.0%
jan 1, 2013
62.044 bln
+8.897 bln
16.74%
jan 1, 2014
77.637 bln
+15.592 bln
25.13%
jan 1, 2015
98.115 bln
+20.478 bln
26.38%
jan 1, 2016
111.301 bln
+13.186 bln
13.44%
Ranking of countries by current statistics by years