Download This statistics in other country:
Timeline:
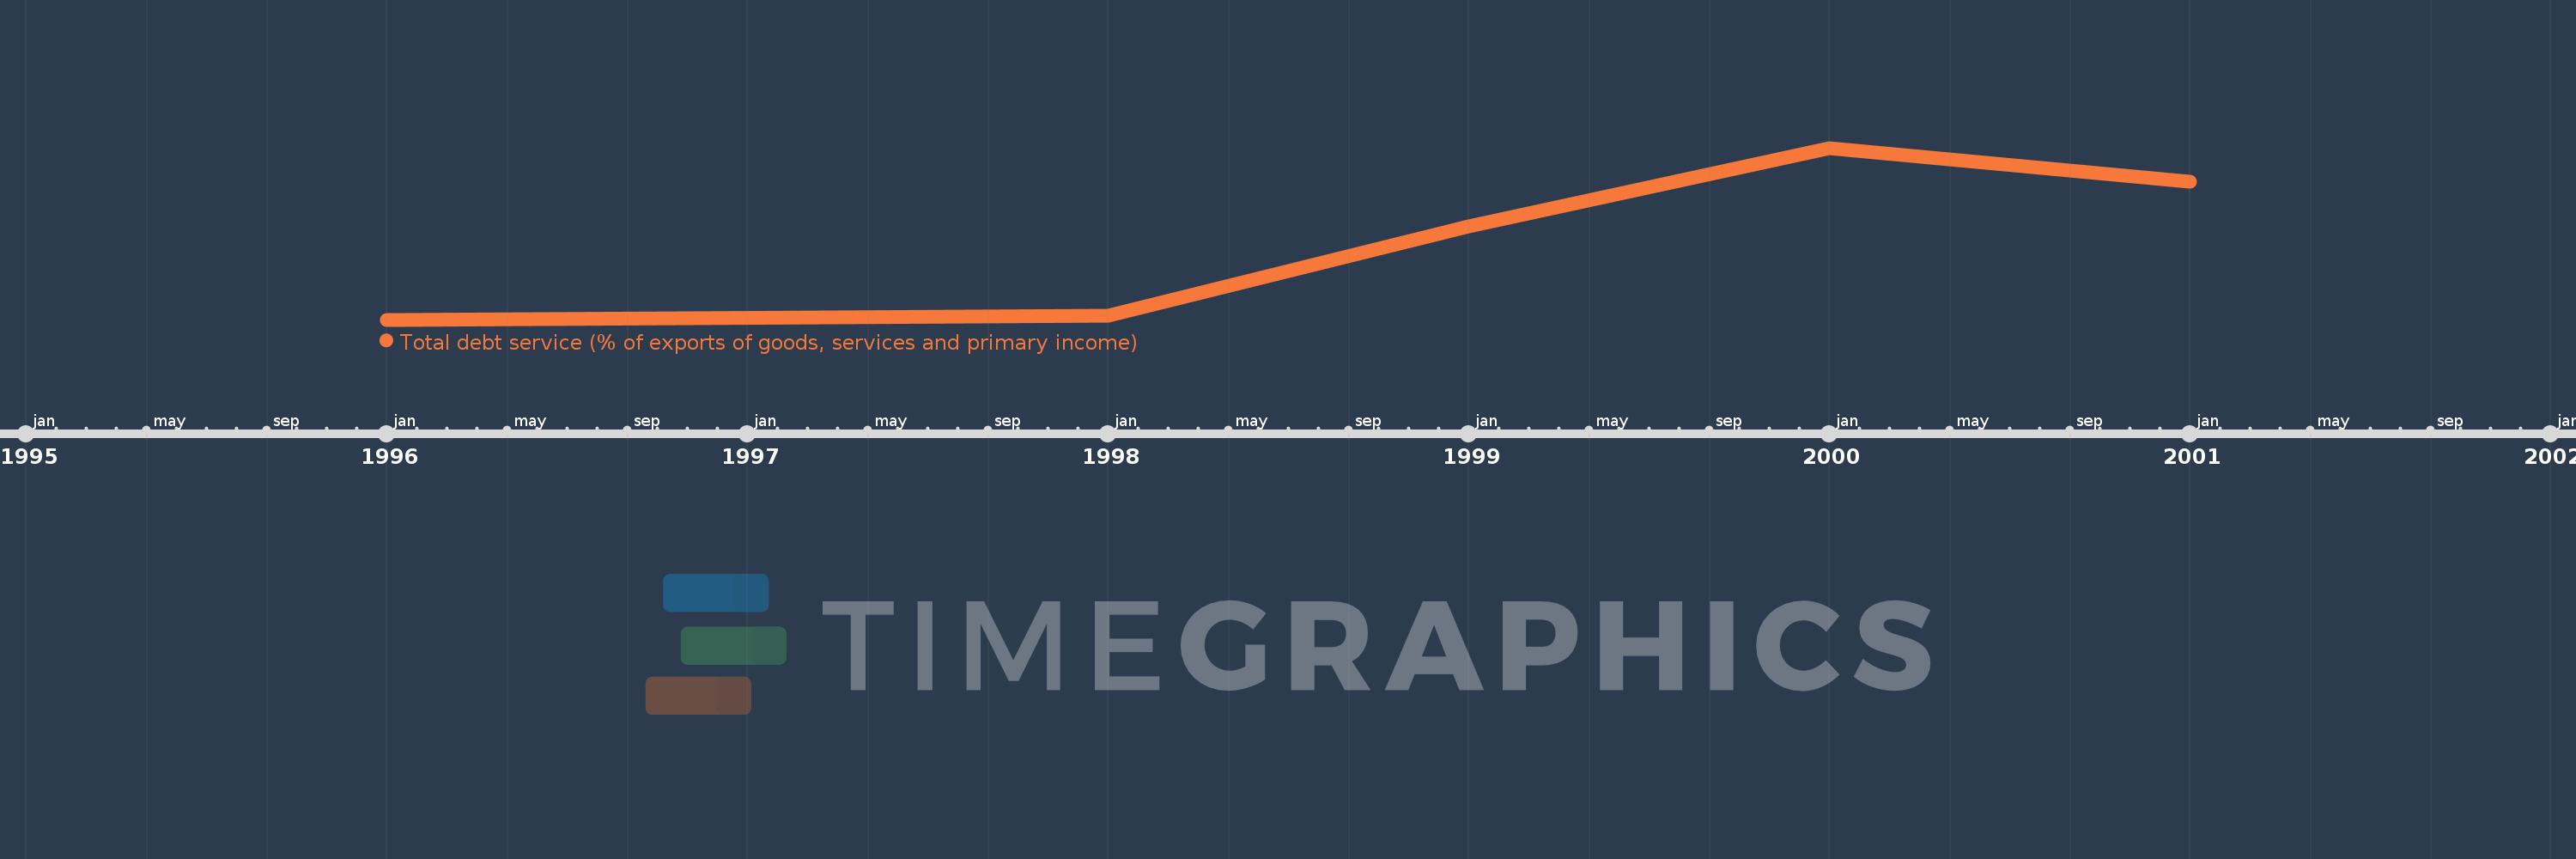
This timeline shows a graph from 1996 to 2001 of Eritrea. No data until 1995. Number of actual observations by date: 5.
Source name:
World Development Indicators
Source organization:
World Bank, International Debt Statistics.
Categories, topics:
Economy & Growth, External Debt
Last updated:
apr 23, 2017
Indicators value changes by year
At the date of observation
Value
Absolute change
Change from the previous value
jan 1, 1996
0.105
+0.105
0.0%
jan 1, 1998
0.223
+0.117
111.38%
jan 1, 1999
2.925
+2.702
1.21K%
jan 1, 2000
5.298
+2.374
81.16%
jan 1, 2001
4.286
-1.012
-19.11%
Ranking of countries by current statistics by years