33
/
AIzaSyB4mHJ5NPEv-XzF7P6NDYXjlkCWaeKw5bc
November 30, 2025
125194
Egypt, Arab Rep.
EGY
true
2
1
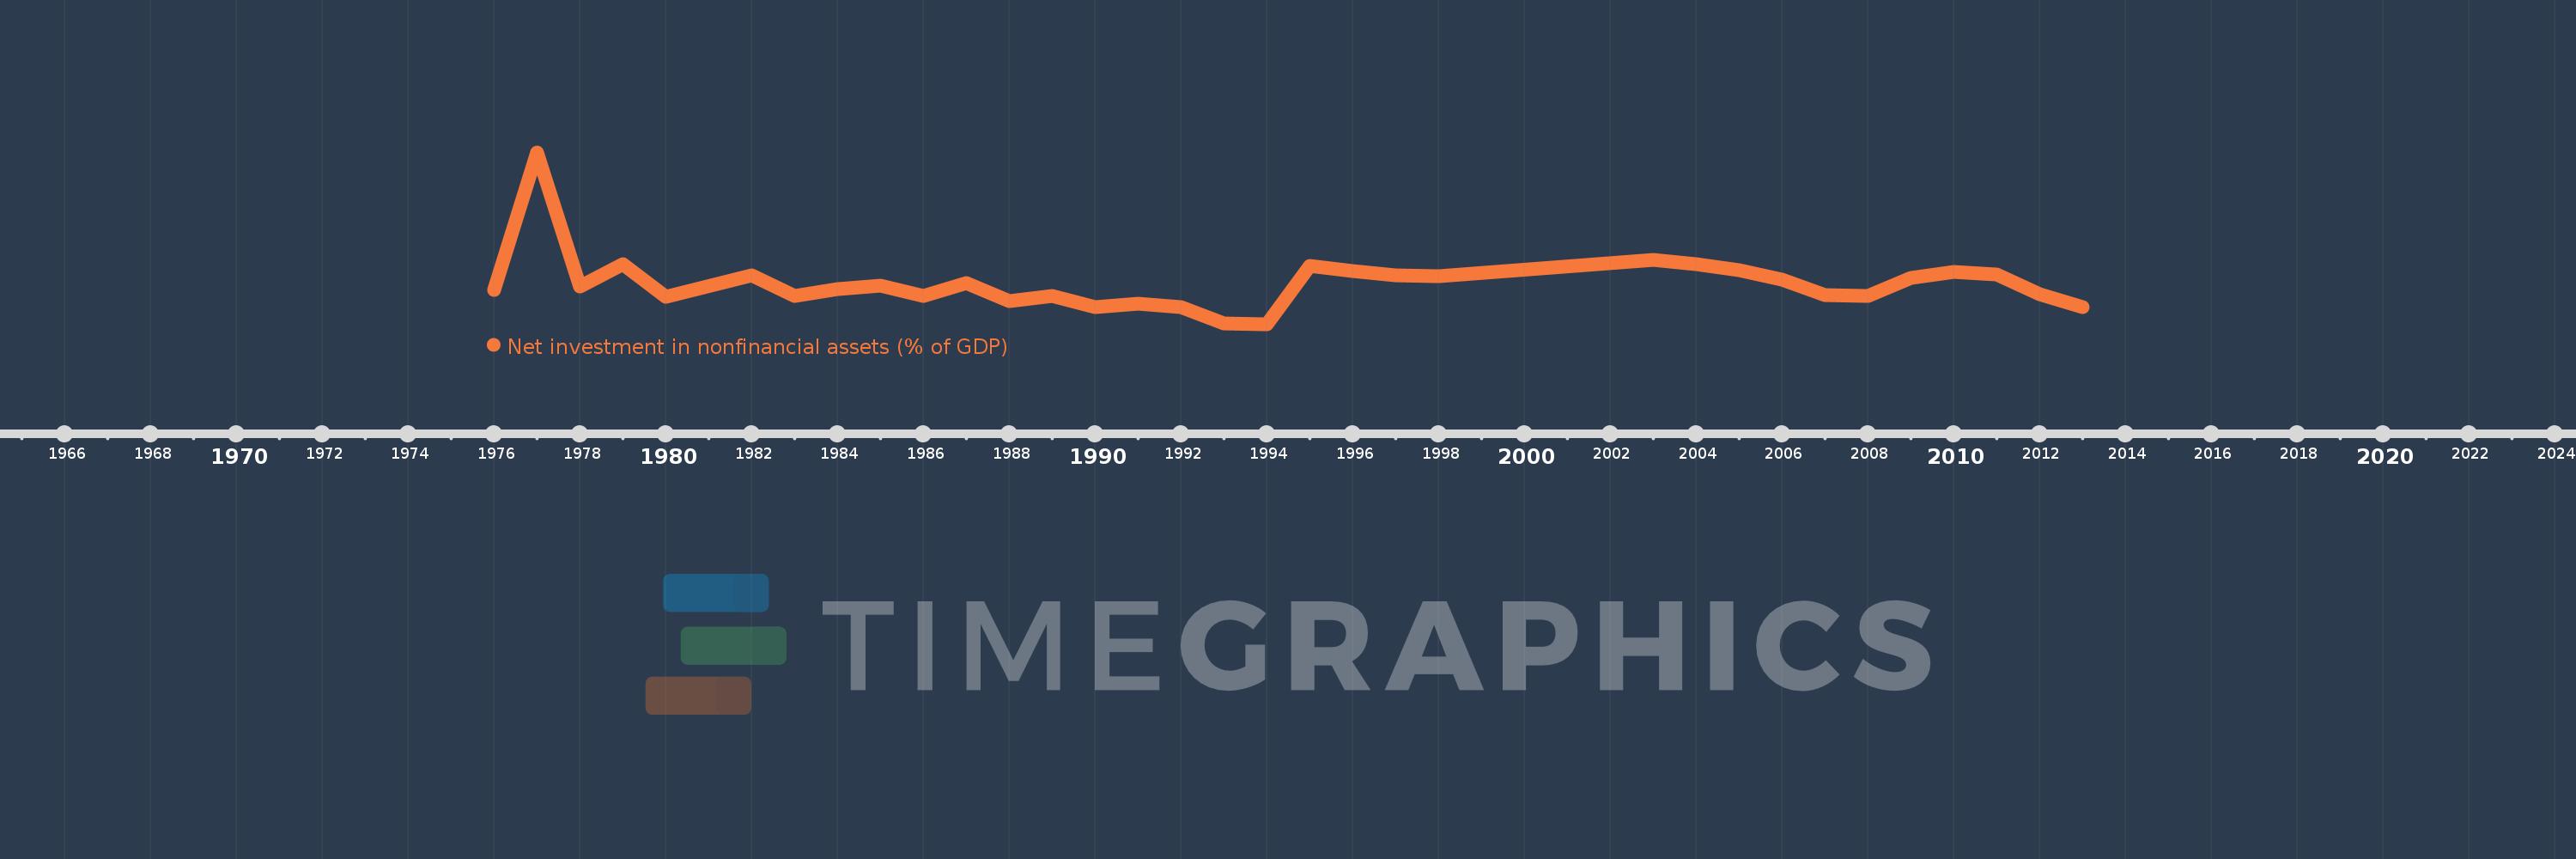
Net investment in nonfinancial assets (% of GDP)
2013,2012,2011,2010,2009,2008,2007,2006,2005,2004,2003,1998,1997,1996,1995,1994,1993,1992,1991,1990,1989,1988,1987,1986,1985,1984,1983,1982,1980,1979,1978,1977,1976