33
/
AIzaSyB4mHJ5NPEv-XzF7P6NDYXjlkCWaeKw5bc
November 30, 2025
124588
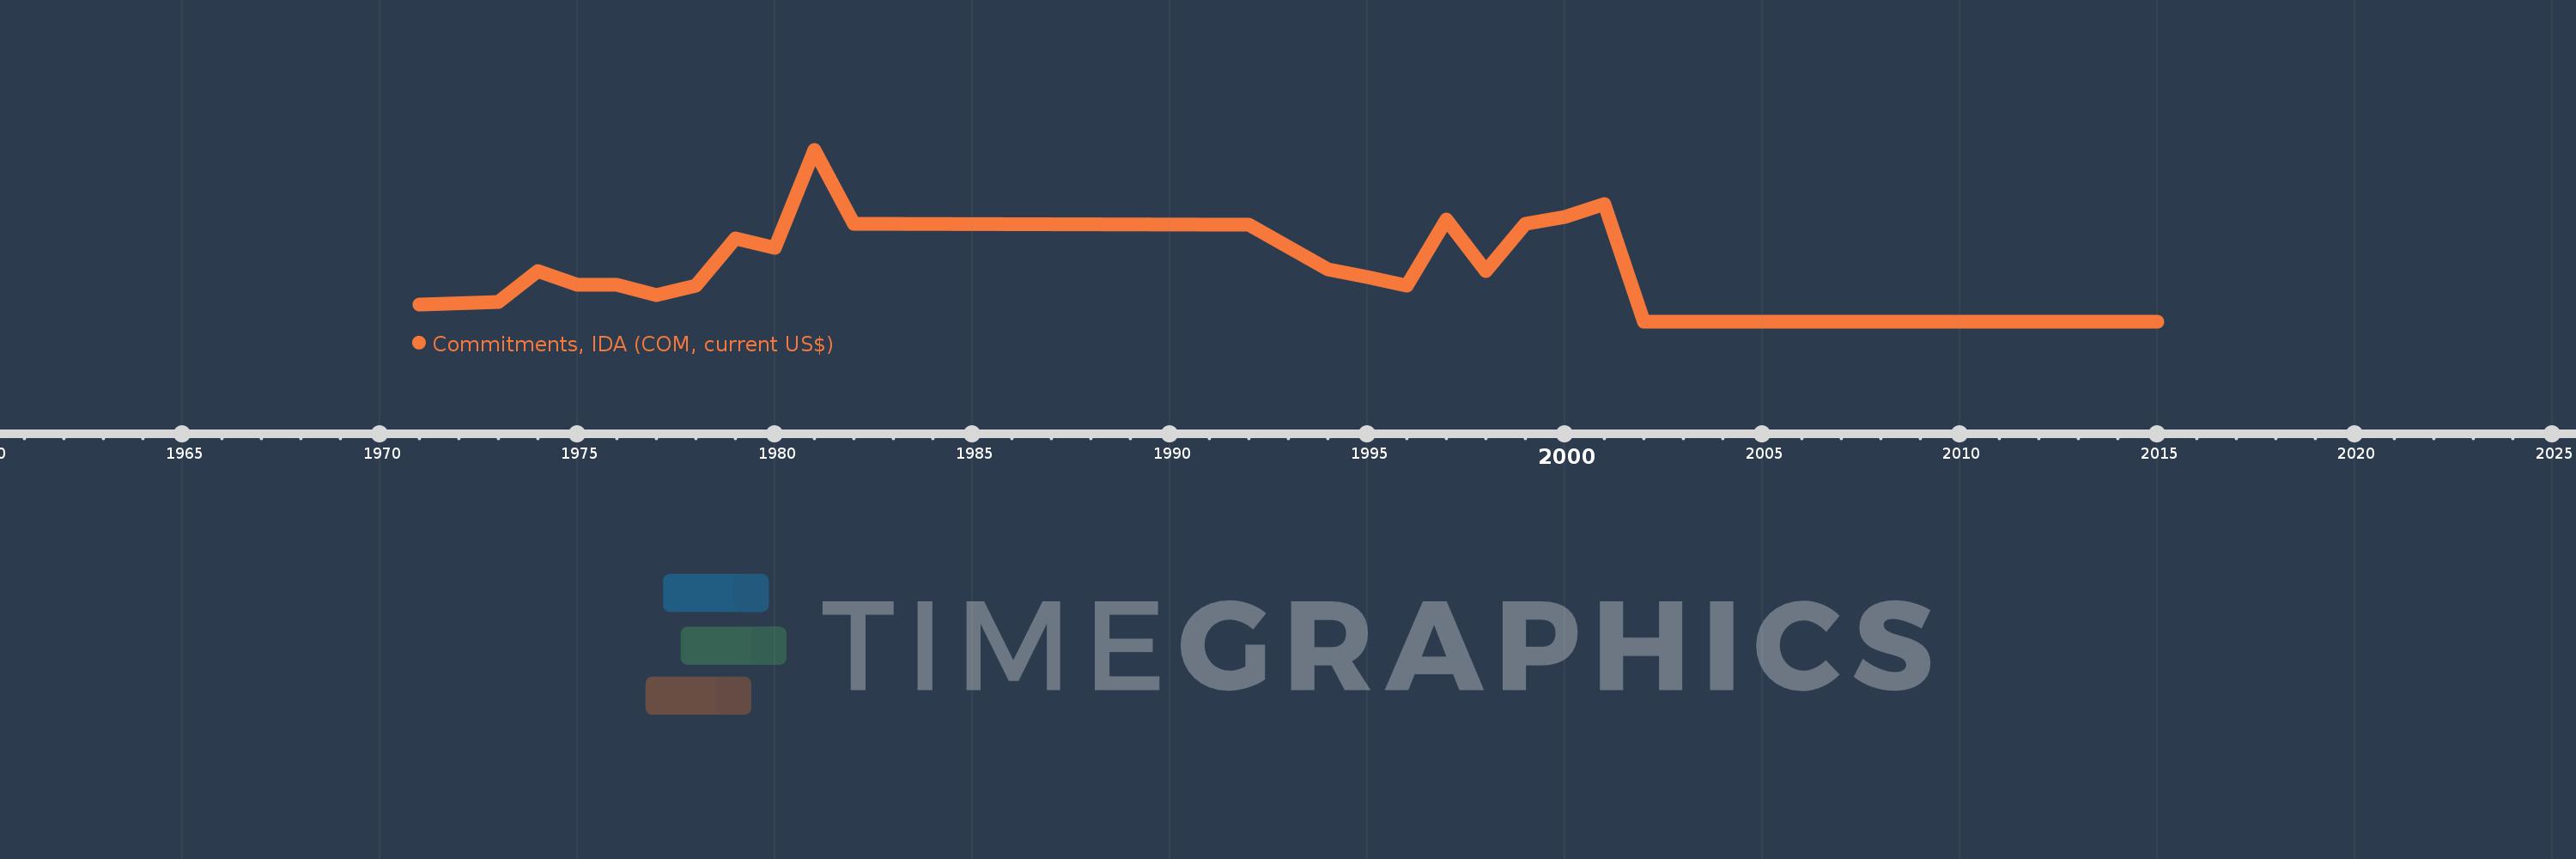
Egypt, Arab Rep.
EGY
true
2
1
Commitments, IDA (COM, current US$)
2015,2014,2013,2011,2010,2009,2008,2005,2002,2001,2000,1999,1998,1997,1996,1995,1994,1993,1992,1982,1981,1980,1979,1978,1977,1976,1975,1974,1973,1971