33
/
AIzaSyB4mHJ5NPEv-XzF7P6NDYXjlkCWaeKw5bc
November 30, 2025
123860
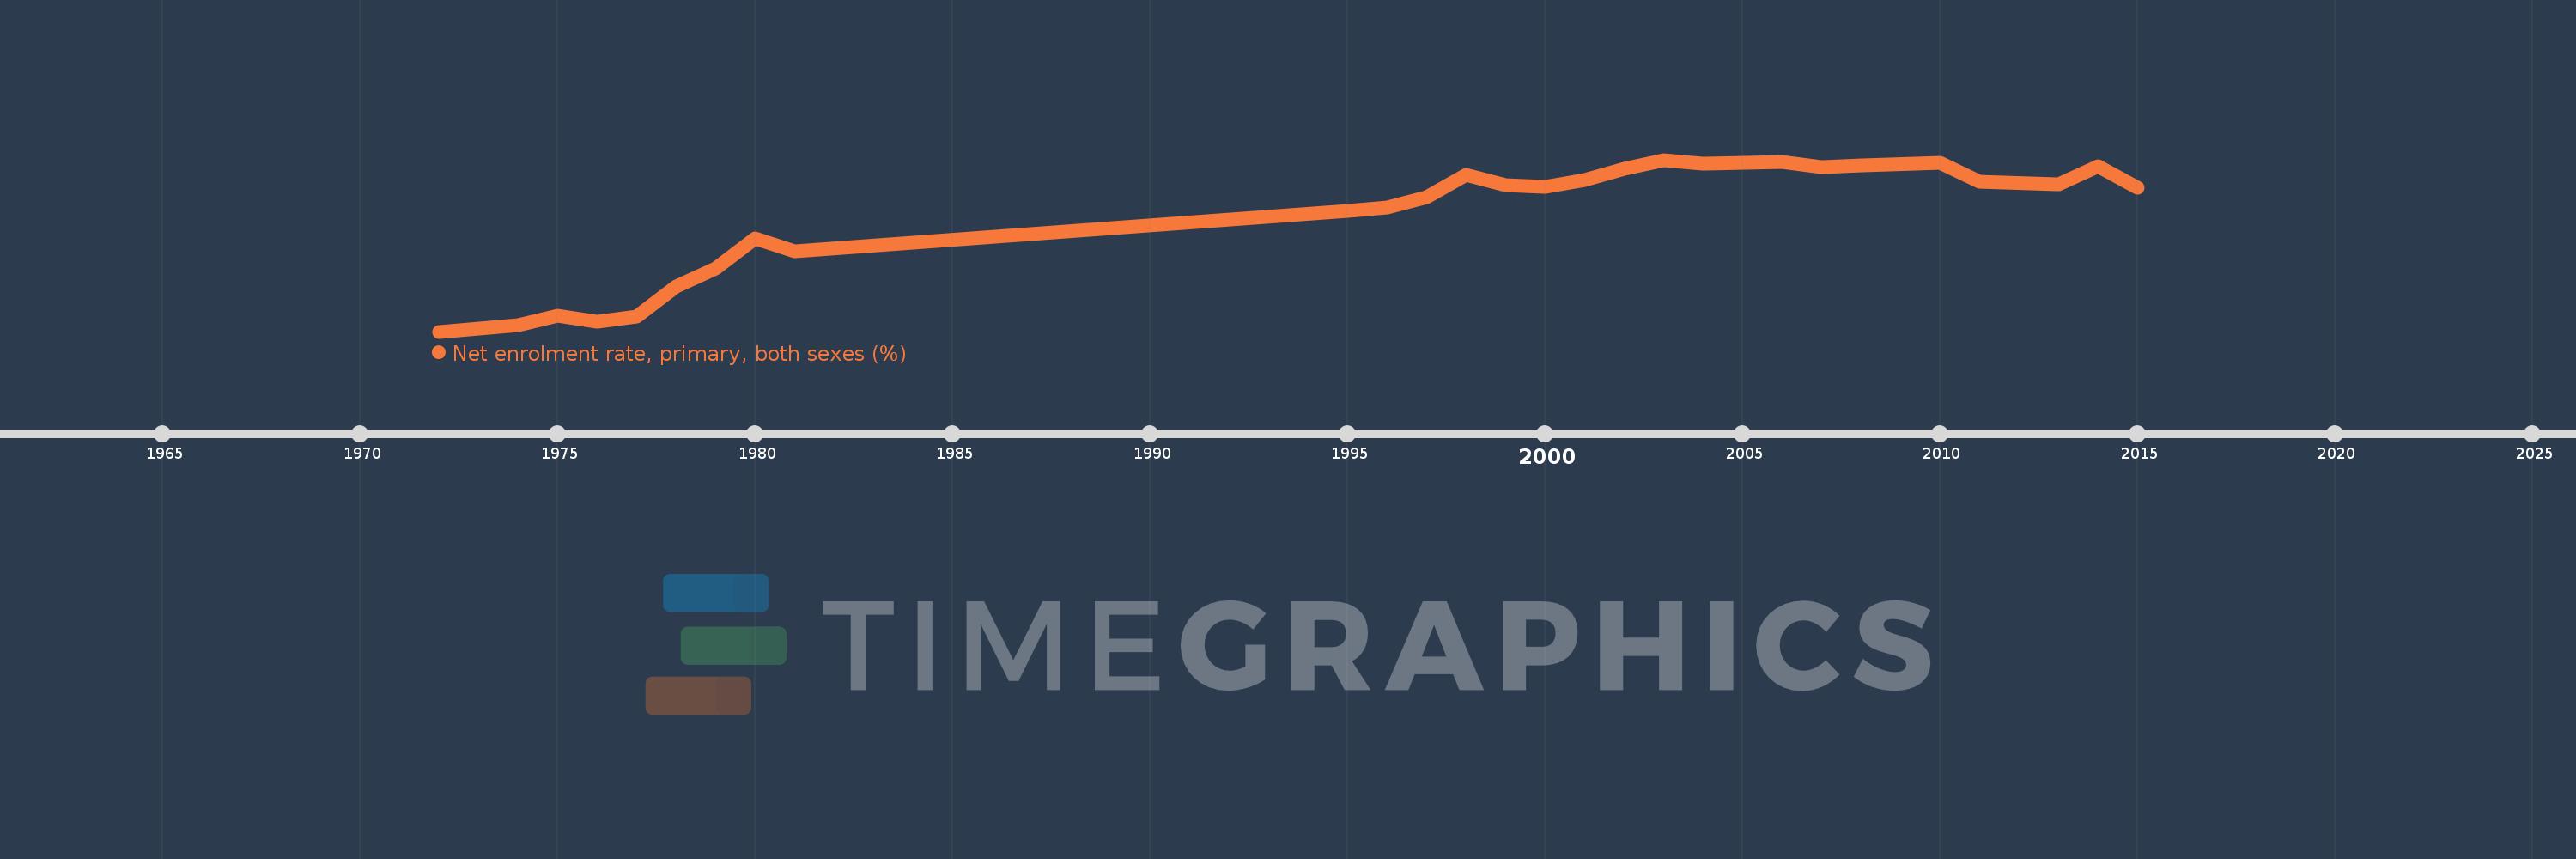
Ecuador
ECU
true
2
1
Net enrolment rate, primary, both sexes (%)
2015,2014,2013,2011,2010,2008,2007,2006,2004,2003,2002,2001,2000,1999,1998,1997,1996,1995,1981,1980,1979,1978,1977,1976,1975,1974,1972