33
/
AIzaSyB4mHJ5NPEv-XzF7P6NDYXjlkCWaeKw5bc
November 30, 2025
122333
Dominican Republic
DOM
true
2
1
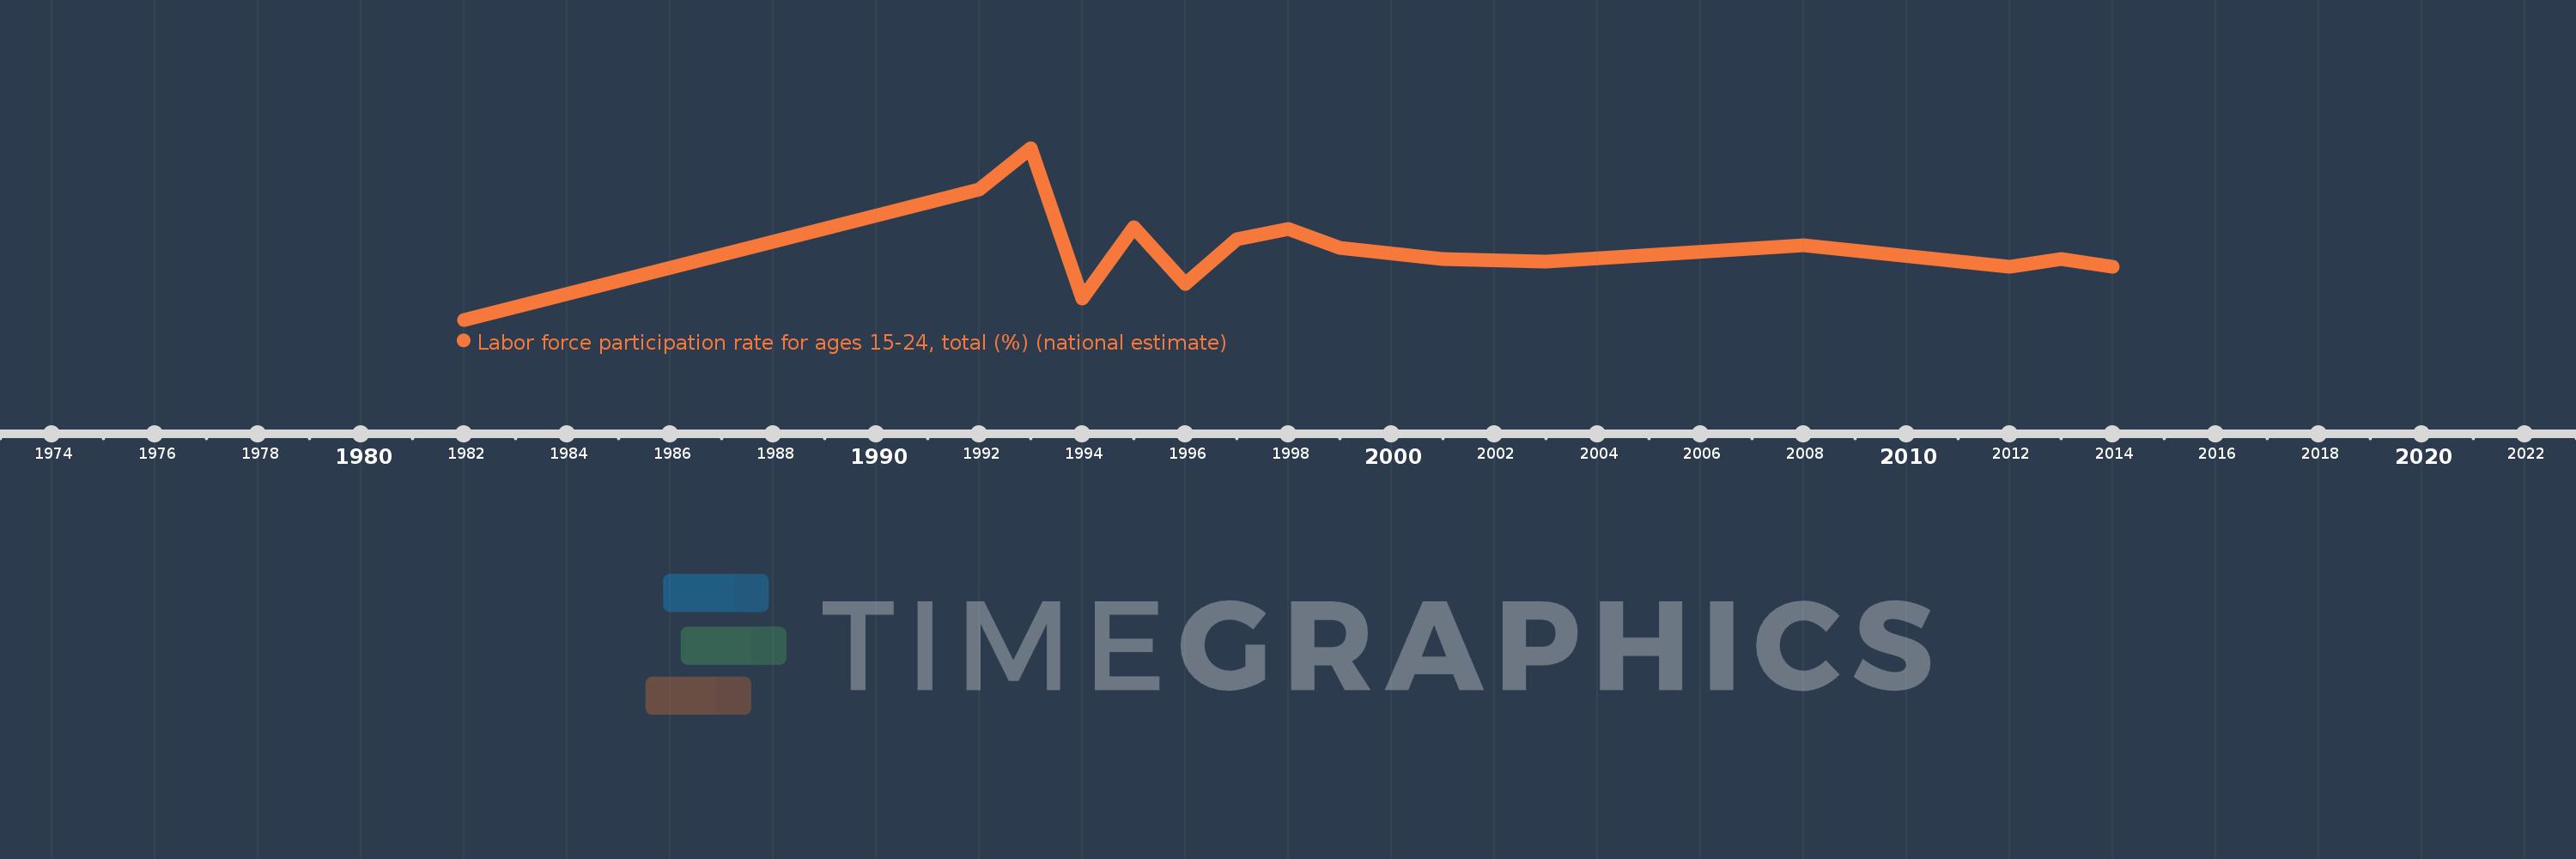
Labor force participation rate for ages 15-24, total (%) (national estimate)
2014,2013,2012,2008,2003,2001,1999,1998,1997,1996,1995,1994,1993,1992,1982