33
/
AIzaSyB4mHJ5NPEv-XzF7P6NDYXjlkCWaeKw5bc
November 30, 2025
119946
Djibouti
DJI
true
2
1
Gross value added at factor cost (current LCU)
2008,2007,2006,2005,2004,2003,2002,2001,2000,1999,1998,1997,1996,1995,1994,1993,1992,1991,1990,1989,1988
Create a timeline
Public Timelines
For education
For educational institutions
For teachers
For students
Cabinet
For educational institutions
For teachers
For students
Open cabinet
FAQ
Close
Create a timeline
Public timelines
FAQ
About & Feedback
Terms
Privacy
FAQ
Support 24/7
Cabinet
Get premium
Donate
Download
Global statistics library
→
Djibouti
→
Gross value added at factor cost (current LCU)
This statistics in other country:
Afghanistan
Albania
Algeria
Andorra
Antigua and Barbuda
Argentina
Armenia
Aruba
Australia
Austria
Azerbaijan
Bahamas, The
Bahrain
Bangladesh
Barbados
Belarus
Belgium
Belize
Benin
Bermuda
Bhutan
Bolivia
Bosnia and Herzegovina
Botswana
Brazil
Bulgaria
Burkina Faso
Burundi
Cabo Verde
Cambodia
Cameroon
Canada
Cayman Islands
Central African Republic
Chad
Chile
Colombia
Congo, Dem. Rep.
Costa Rica
Croatia
Cuba
Cyprus
Czech Republic
Denmark
Djibouti
Dominica
Dominican Republic
Ecuador
Egypt, Arab Rep.
El Salvador
Equatorial Guinea
Eritrea
Estonia
Ethiopia
Faroe Islands
Fiji
Finland
France
Gabon
Gambia, The
Georgia
Germany
Ghana
Greece
Grenada
Guatemala
Guinea
Guinea-Bissau
Guyana
Honduras
Hong Kong SAR, China
Hungary
Iceland
India
Indonesia
Iran, Islamic Rep.
Ireland
Italy
Jamaica
Japan
Jordan
Kazakhstan
Kenya
Kiribati
Korea, Rep.
Kosovo
Kuwait
Kyrgyz Republic
Lao PDR
Latvia
Lebanon
Lesotho
Liberia
Libya
Liechtenstein
Lithuania
Luxembourg
Macao SAR, China
Macedonia, FYR
Madagascar
Malawi
Malaysia
Maldives
Mali
Malta
Marshall Islands
Mauritania
Mauritius
Mexico
Micronesia, Fed. Sts.
Moldova
Mongolia
Montenegro
Morocco
Mozambique
Namibia
Nepal
Netherlands
New Zealand
Nicaragua
Nigeria
Norway
Oman
Pakistan
Palau
Panama
Papua New Guinea
Paraguay
Peru
Poland
Portugal
Romania
Russian Federation
Rwanda
Sao Tome and Principe
Senegal
Serbia
Seychelles
Sierra Leone
Singapore
Slovak Republic
Slovenia
Solomon Islands
Somalia
South Africa
Spain
Sri Lanka
St. Kitts and Nevis
St. Lucia
St. Vincent and the Grenadines
Sudan
Suriname
Swaziland
Sweden
Switzerland
Syrian Arab Republic
Tajikistan
Tanzania
Thailand
Timor-Leste
Tonga
Trinidad and Tobago
Tunisia
Turkey
Turkmenistan
Tuvalu
Uganda
Ukraine
United Kingdom
United States
Uruguay
Uzbekistan
Vanuatu
Venezuela, RB
Vietnam
West Bank and Gaza
Yemen, Rep.
Zambia
Zimbabwe
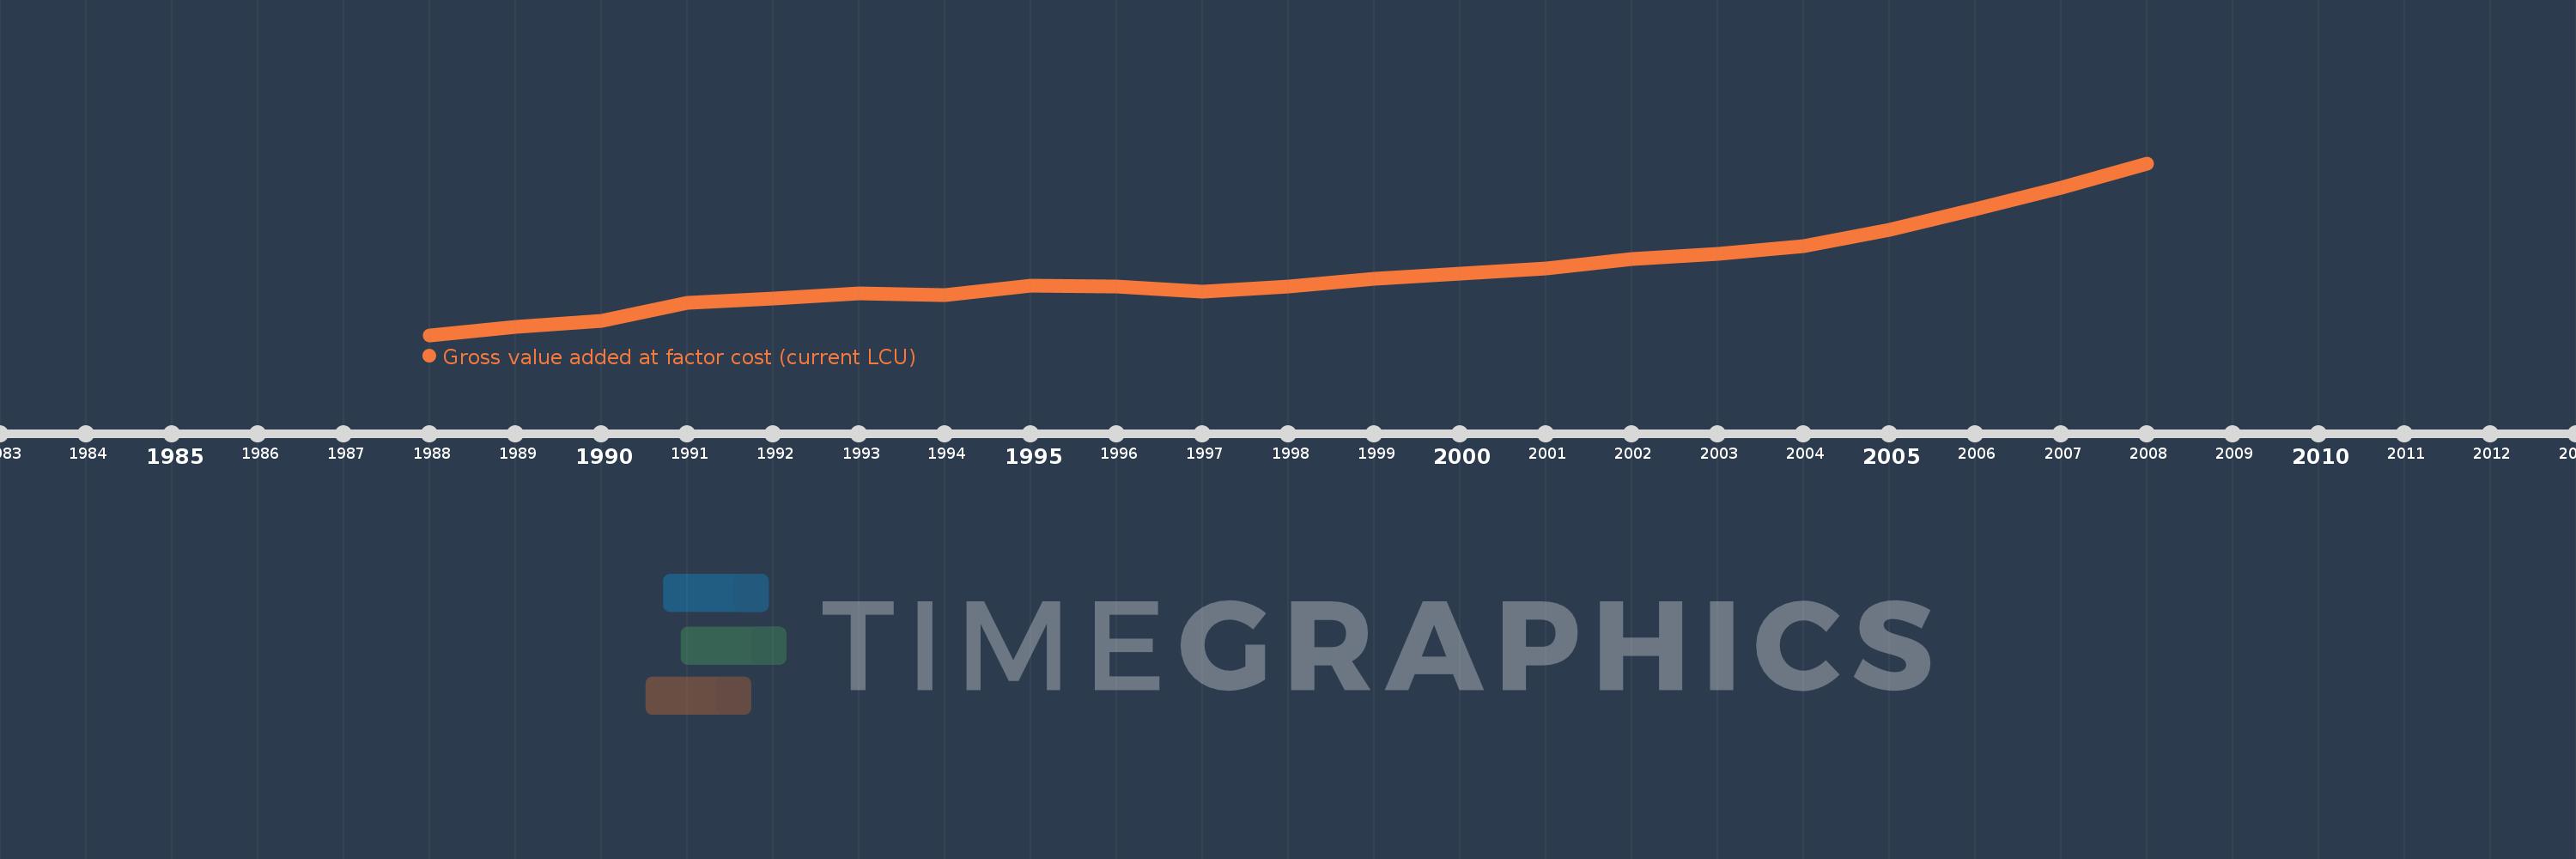
Timeline:
This timeline shows a graph from
1988
to
2008
of Djibouti. No data until
1987
. Number of actual observations by date:
21
.
Source name:
World Development Indicators
Source organization:
World Bank national accounts data, and OECD National Accounts data files.
Categories, topics:
Economy & Growth
Last updated:
apr 23, 2017
Indicators value changes by year
Meaning:
84.41 bln
Minimum:
55.727 bln
jan 1, 1988
Maximum:
132.805 bln
jan 1, 2008
At the date of observation
Value
Absolute change
Change from the previous value
jan 1, 1988
55.727 bln
+55.727 bln
0.0%
jan 1, 1989
59.493 bln
+3.766 bln
6.76%
jan 1, 1990
62.226 bln
+2.733 bln
4.59%
jan 1, 1991
70.151 bln
+7.925 bln
12.74%
jan 1, 1992
71.945 bln
+1.794 bln
2.56%
jan 1, 1993
74.412 bln
+2.467 bln
3.43%
jan 1, 1994
73.653 bln
-759.4 mln
-1.02%
jan 1, 1995
77.712 bln
+4.059 bln
5.51%
jan 1, 1996
77.486 bln
-225.5 mln
-0.29%
jan 1, 1997
75.071 bln
-2.415 bln
-3.12%
jan 1, 1998
77.538 bln
+2.467 bln
3.29%
jan 1, 1999
81.061 bln
+3.523 bln
4.54%
jan 1, 2000
83.302 bln
+2.241 bln
2.76%
jan 1, 2001
85.548 bln
+2.246 bln
2.7%
jan 1, 2002
89.813 bln
+4.264 bln
4.98%
jan 1, 2003
91.964 bln
+2.152 bln
2.4%
jan 1, 2004
95.754 bln
+3.79 bln
4.12%
jan 1, 2005
103.033 bln
+7.279 bln
7.6%
jan 1, 2006
112.061 bln
+9.028 bln
8.76%
jan 1, 2007
121.856 bln
+9.795 bln
8.74%
jan 1, 2008
132.805 bln
+10.949 bln
8.99%
Ranking of countries by current statistics by years
About & Feedback
Terms
Privacy
FAQ
Support 24/7
Cabinet
Get premium
Donate
The service accepts bank transfer (ACH, Wire) or cards (Visa, MasterCard, etc). Processed by Stripe.
Secured with SSL