33
/
AIzaSyB4mHJ5NPEv-XzF7P6NDYXjlkCWaeKw5bc
November 30, 2025
114883
Croatia
HRV
true
2
1
Gross value added at factor cost (constant LCU)
2016,2015,2014,2013,2012,2011,2010,2009,2008,2007,2006,2005,2004,2003,2002,2001,2000,1999,1998,1997,1996
Create a timeline
Public Timelines
For education
For educational institutions
For teachers
For students
Cabinet
For educational institutions
For teachers
For students
Open cabinet
FAQ
Close
Create a timeline
Public timelines
FAQ
About & Feedback
Terms
Privacy
FAQ
Support 24/7
Cabinet
Get premium
Donate
Download
Global statistics library
→
Croatia
→
Gross value added at factor cost (constant LCU)
This statistics in other country:
Afghanistan
Albania
Algeria
Antigua and Barbuda
Argentina
Armenia
Australia
Austria
Azerbaijan
Bahamas, The
Bangladesh
Belarus
Belgium
Belize
Benin
Bermuda
Bhutan
Bolivia
Bosnia and Herzegovina
Botswana
Brazil
Bulgaria
Burkina Faso
Burundi
Cabo Verde
Cambodia
Cameroon
Canada
Cayman Islands
Central African Republic
Chad
Chile
Colombia
Congo, Dem. Rep.
Costa Rica
Cote d'Ivoire
Croatia
Cuba
Cyprus
Czech Republic
Denmark
Djibouti
Dominica
Dominican Republic
Ecuador
Egypt, Arab Rep.
El Salvador
Equatorial Guinea
Eritrea
Estonia
Ethiopia
Fiji
Finland
France
Gabon
Gambia, The
Georgia
Germany
Ghana
Greece
Grenada
Guatemala
Guinea
Guinea-Bissau
Guyana
Haiti
Honduras
Hong Kong SAR, China
Hungary
Iceland
India
Indonesia
Iran, Islamic Rep.
Ireland
Italy
Jamaica
Japan
Jordan
Kazakhstan
Kenya
Kiribati
Korea, Rep.
Kosovo
Kuwait
Kyrgyz Republic
Lao PDR
Latvia
Lebanon
Lesotho
Liberia
Lithuania
Luxembourg
Macedonia, FYR
Madagascar
Malawi
Maldives
Mali
Marshall Islands
Mauritania
Mauritius
Mexico
Micronesia, Fed. Sts.
Moldova
Mongolia
Montenegro
Morocco
Mozambique
Namibia
Nepal
Netherlands
New Zealand
Nicaragua
Nigeria
Norway
Oman
Pakistan
Palau
Panama
Papua New Guinea
Paraguay
Peru
Philippines
Poland
Portugal
Romania
Russian Federation
Rwanda
Sao Tome and Principe
Senegal
Serbia
Seychelles
Sierra Leone
Singapore
Slovak Republic
Slovenia
Solomon Islands
Somalia
South Africa
Spain
Sri Lanka
St. Kitts and Nevis
St. Lucia
St. Vincent and the Grenadines
Sudan
Suriname
Swaziland
Sweden
Switzerland
Syrian Arab Republic
Tajikistan
Tanzania
Thailand
Timor-Leste
Tonga
Trinidad and Tobago
Tunisia
Turkey
Turkmenistan
Tuvalu
Uganda
Ukraine
United Arab Emirates
United Kingdom
United States
Uruguay
Uzbekistan
Vanuatu
Venezuela, RB
Vietnam
West Bank and Gaza
Zambia
Zimbabwe
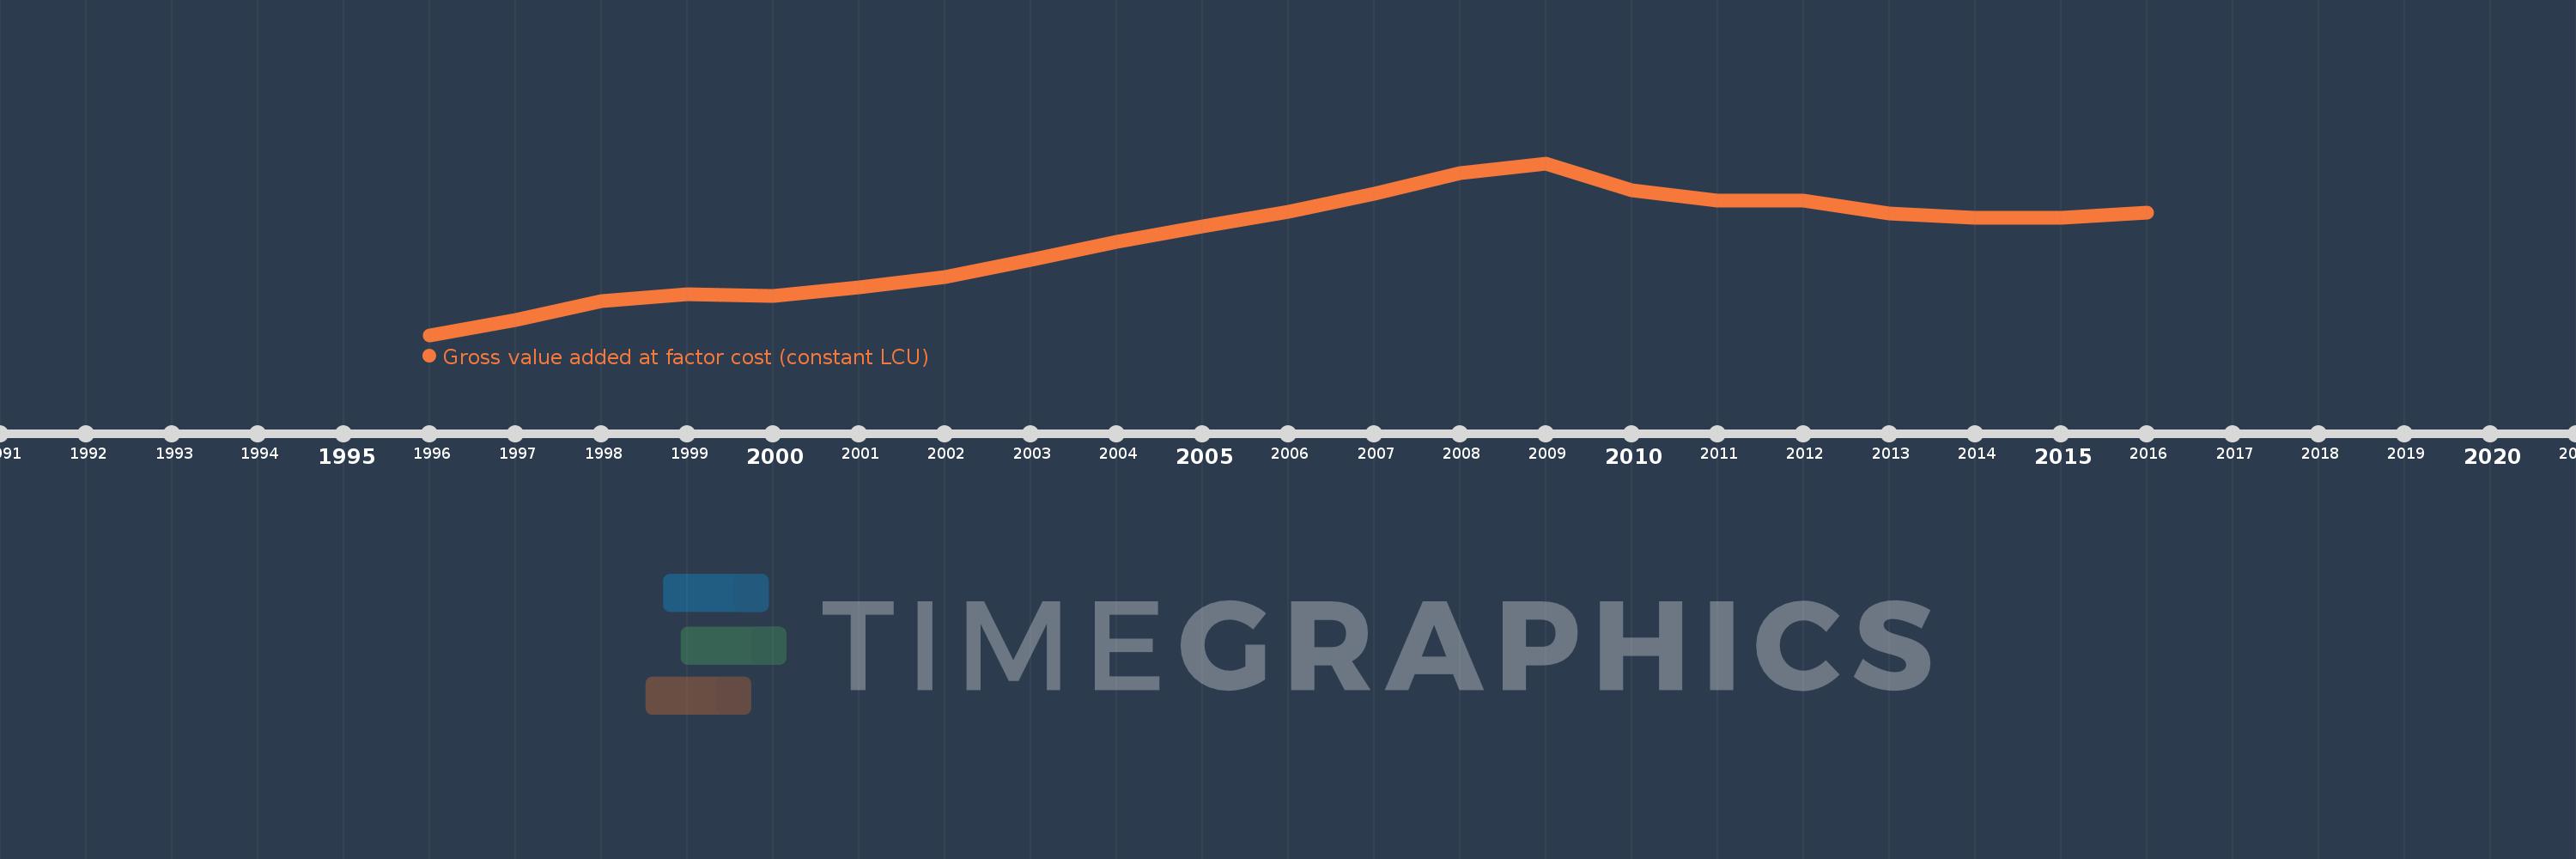
Timeline:
This timeline shows a graph from
1996
to
2016
of Croatia. No data until
1995
. Number of actual observations by date:
21
.
Source name:
World Development Indicators
Source organization:
World Bank national accounts data, and OECD National Accounts data files.
Categories, topics:
Economy & Growth
Last updated:
apr 23, 2017
Indicators value changes by year
Meaning:
252.655 bln
Minimum:
184.838 bln
jan 1, 1996
Maximum:
306.984 bln
jan 1, 2009
At the date of observation
Value
Absolute change
Change from the previous value
jan 1, 1996
184.838 bln
+184.838 bln
0.0%
jan 1, 1997
195.727 bln
+10.889 bln
5.89%
jan 1, 1998
209.101 bln
+13.374 bln
6.83%
jan 1, 1999
214.062 bln
+4.962 bln
2.37%
jan 1, 2000
212.825 bln
-1.238 bln
-0.58%
jan 1, 2001
218.581 bln
+5.756 bln
2.7%
jan 1, 2002
226.295 bln
+7.714 bln
3.53%
jan 1, 2003
237.973 bln
+11.678 bln
5.16%
jan 1, 2004
251.245 bln
+13.271 bln
5.58%
jan 1, 2005
261.969 bln
+10.724 bln
4.27%
jan 1, 2006
272.495 bln
+10.526 bln
4.02%
jan 1, 2007
285.433 bln
+12.938 bln
4.75%
jan 1, 2008
299.779 bln
+14.346 bln
5.03%
jan 1, 2009
306.984 bln
+7.205 bln
2.4%
jan 1, 2010
287.631 bln
-19.353 bln
-6.3%
jan 1, 2011
280.465 bln
-7.166 bln
-2.49%
jan 1, 2012
280.39 bln
-75.072 mln
-0.03%
jan 1, 2013
271.46 bln
-8.93 bln
-3.18%
jan 1, 2014
268.459 bln
-3.001 bln
-1.11%
jan 1, 2015
268.155 bln
-304.113 mln
-0.11%
jan 1, 2016
271.885 bln
+3.73 bln
1.39%
Ranking of countries by current statistics by years
About & Feedback
Terms
Privacy
FAQ
Support 24/7
Cabinet
Get premium
Donate
The service accepts bank transfer (ACH, Wire) or cards (Visa, MasterCard, etc). Processed by Stripe.
Secured with SSL