Download This statistics in other country:
Timeline:
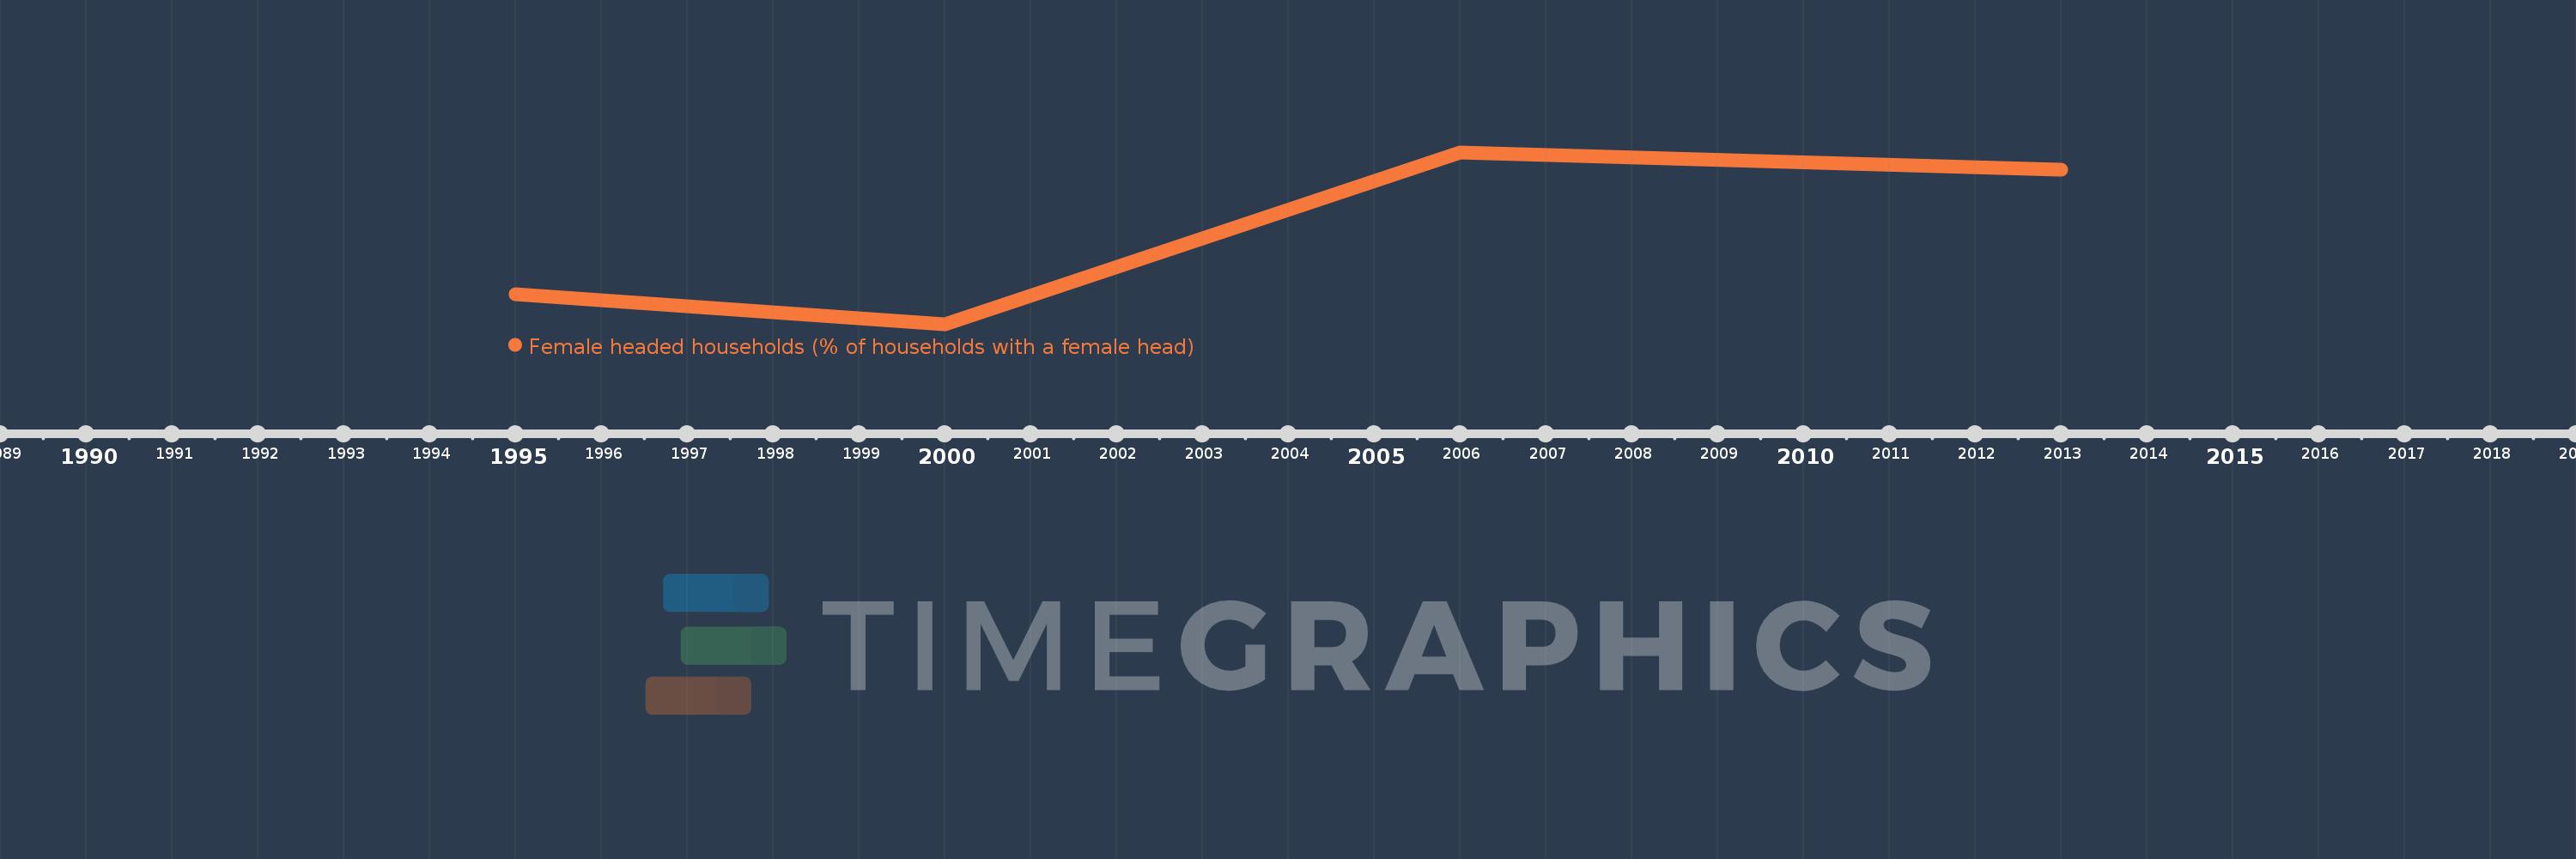
This timeline shows a graph from 1995 to 2013 of Cote d'Ivoire. No data until 1994. Number of actual observations by date: 4.
Source name:
World Development Indicators
Source organization:
Demographic and Health Surveys.
Categories, topics:
Health, Gender
Last updated:
apr 23, 2017
Indicators value changes by year
At the date of observation
Value
Absolute change
Change from the previous value
jan 1, 1995
15.1
+15.1
0.0%
jan 1, 2000
14.4
-0.7
-4.64%
jan 1, 2006
18.4
+4.0
27.78%
jan 1, 2013
18.0
-0.4
-2.17%
Ranking of countries by current statistics by years