Download This statistics in other country:
Timeline:
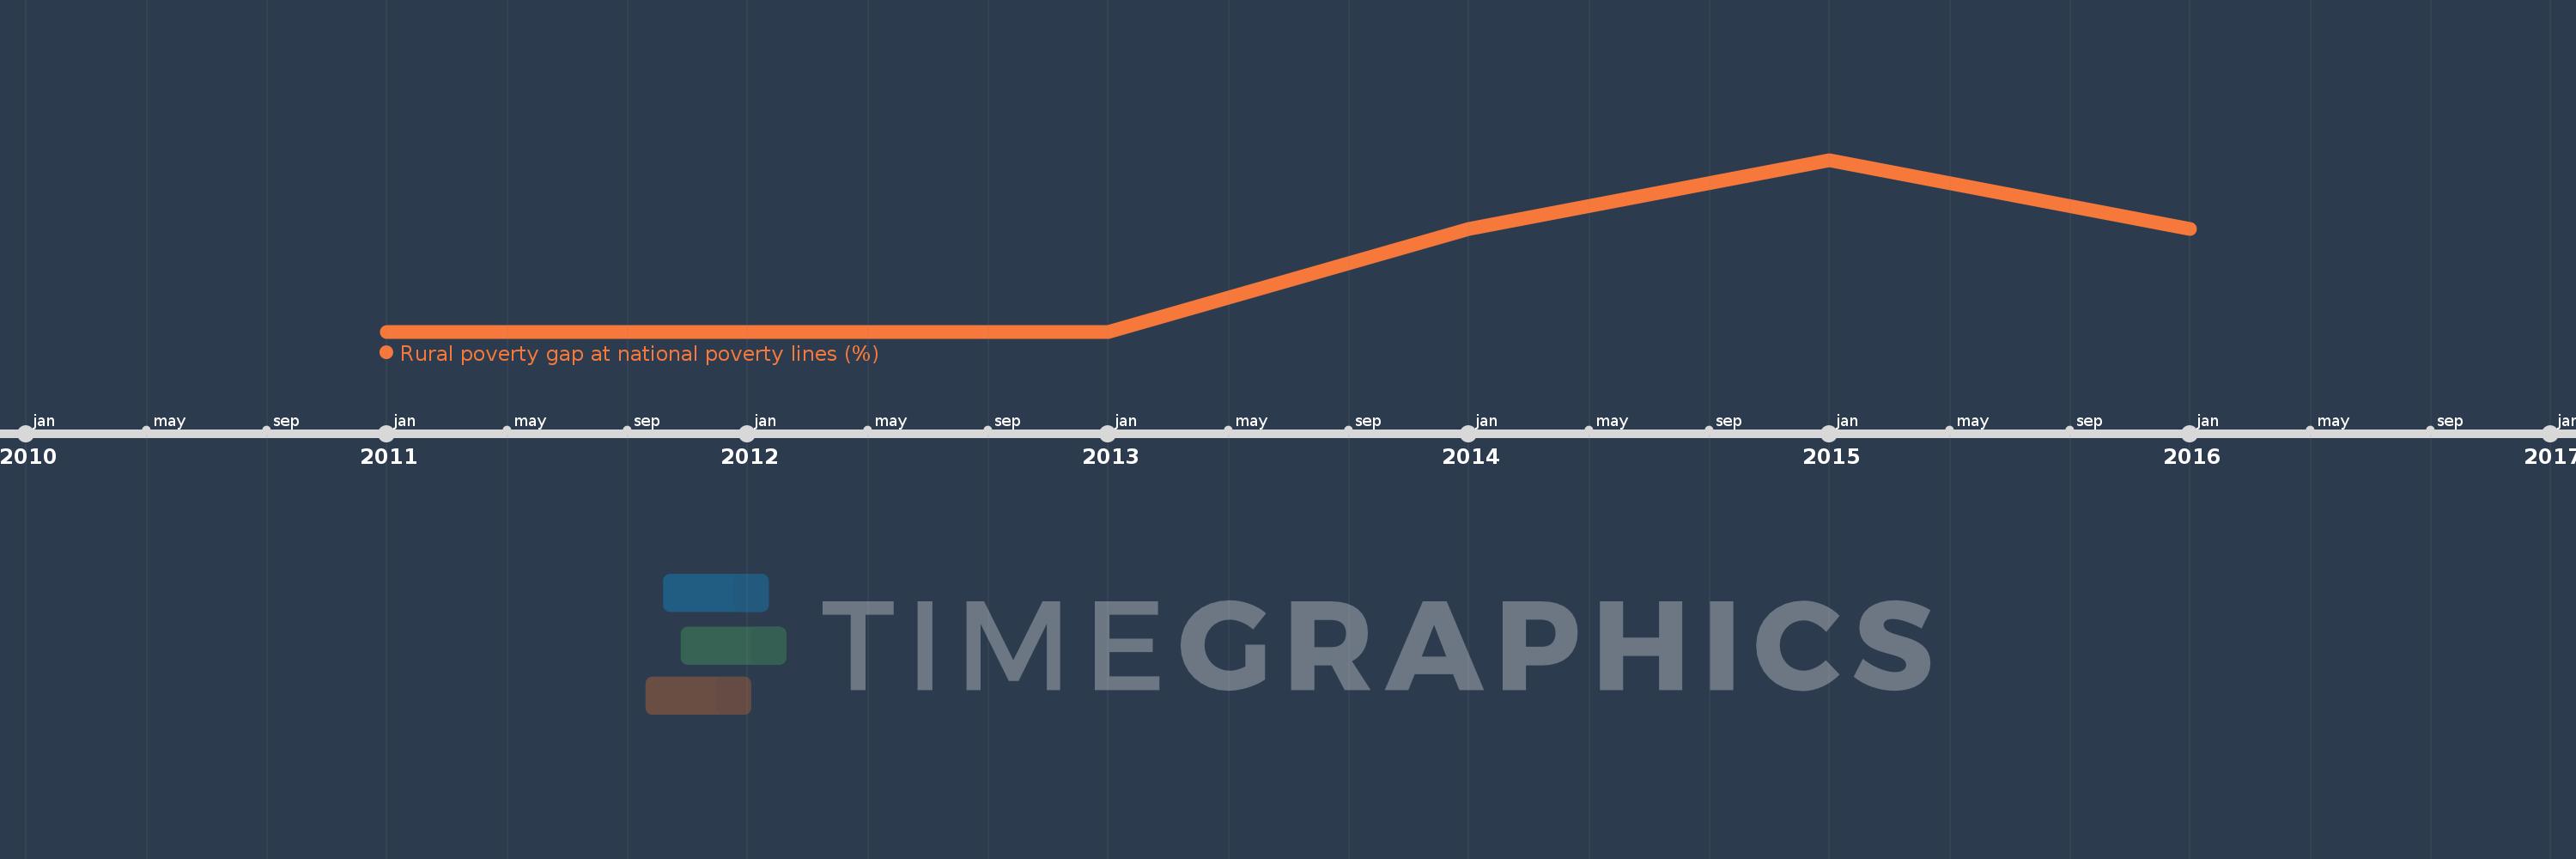
This timeline shows a graph from 2011 to 2016 of Costa Rica. No data until 2010. Number of actual observations by date: 6.
Source name:
World Development Indicators
Source organization:
World Bank, Global Poverty Working Group. Data are compiled from official government sources or are computed by World Bank staff using national (i.e. country–specific) poverty lines.
Categories, topics:
Agriculture & Rural Development, Poverty
Last updated:
apr 23, 2017
Indicators value changes by year
At the date of observation
Value
Absolute change
Change from the previous value
jan 1, 2011
11.3
+11.3
0.0%
jan 1, 2014
11.9
+0.6
5.31%
jan 1, 2015
12.3
+0.4
3.36%
jan 1, 2016
11.9
-0.4
-3.25%
Ranking of countries by current statistics by years