33
/
AIzaSyB4mHJ5NPEv-XzF7P6NDYXjlkCWaeKw5bc
November 30, 2025
108948
Comoros
COM
true
2
1
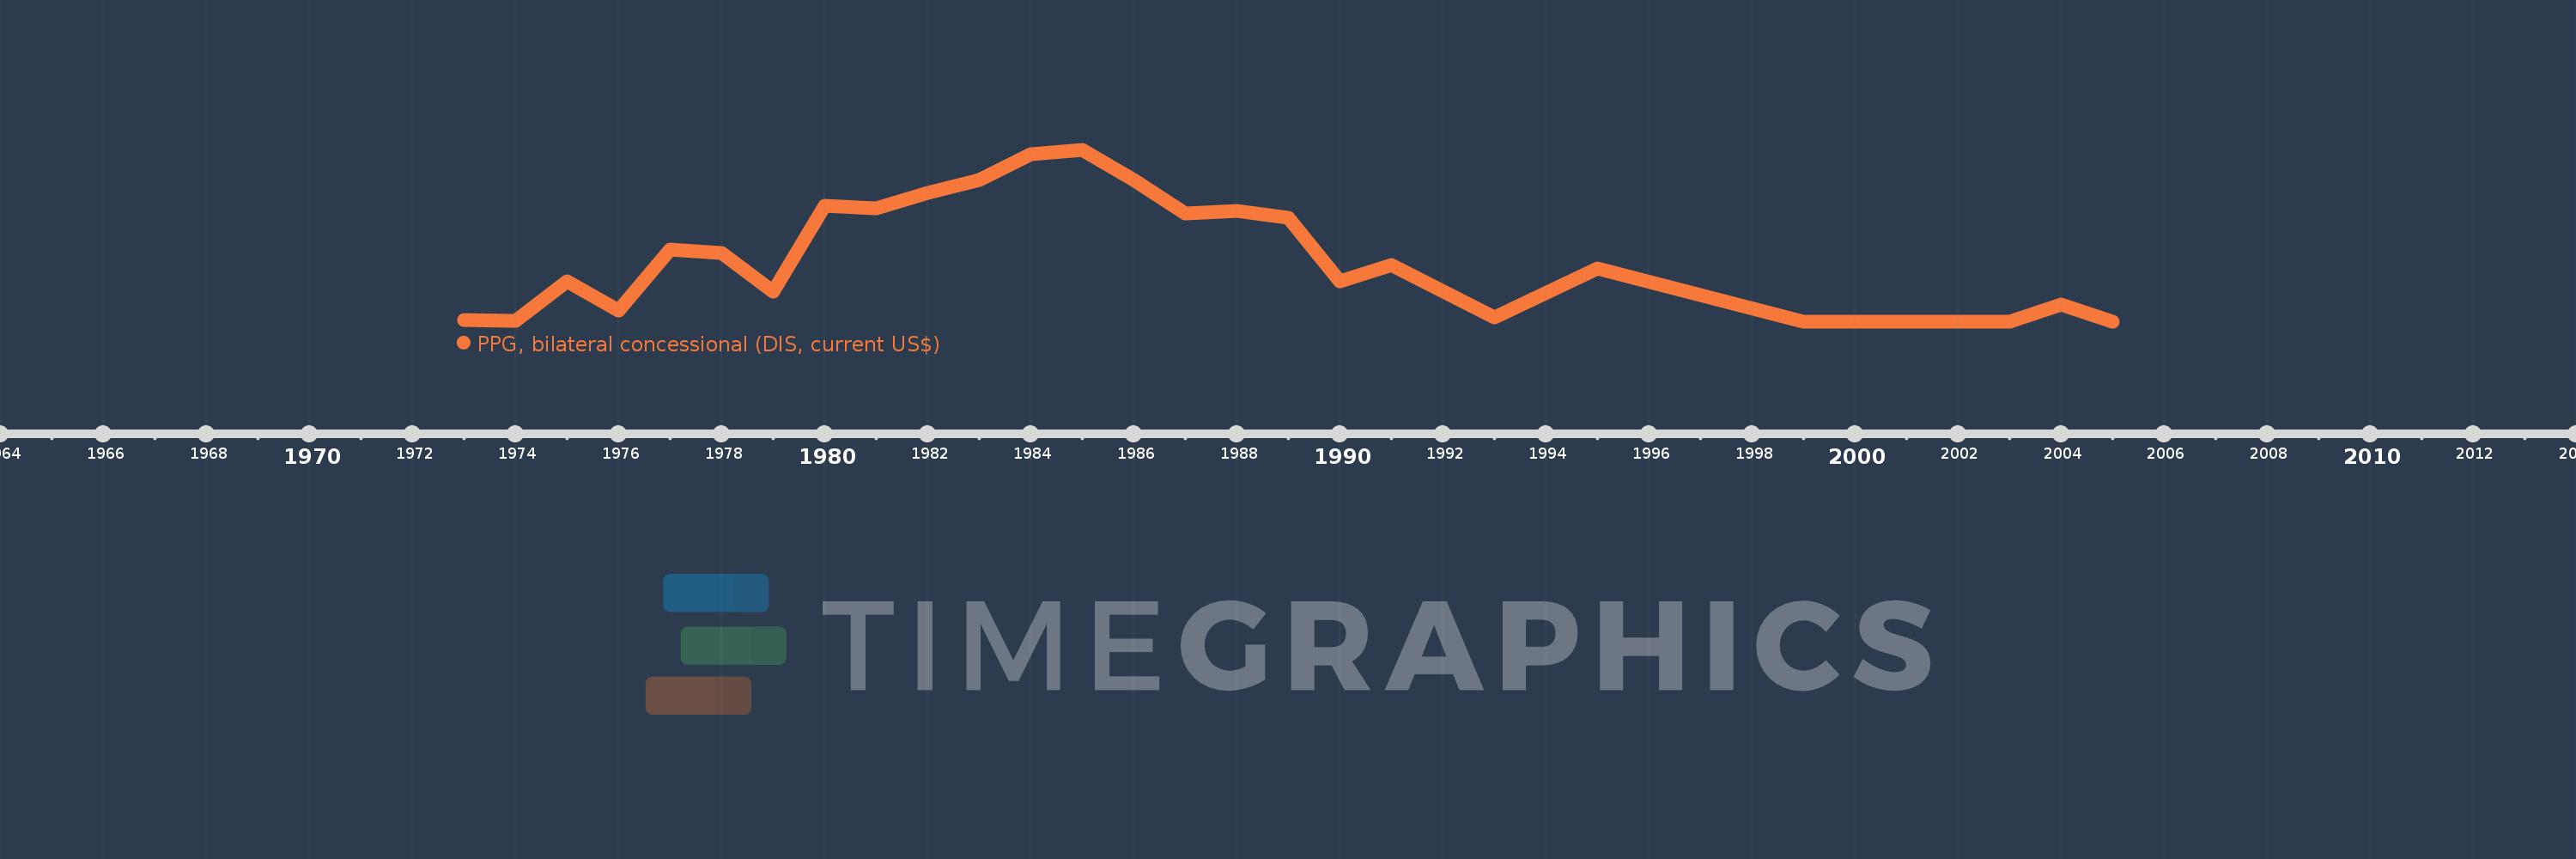
PPG, bilateral concessional (DIS, current US$)
2005,2004,2003,2000,1999,1995,1993,1991,1990,1989,1988,1987,1986,1985,1984,1983,1982,1981,1980,1979,1978,1977,1976,1975,1974,1973