33
/
AIzaSyB4mHJ5NPEv-XzF7P6NDYXjlkCWaeKw5bc
November 30, 2025
108059
Colombia
COL
true
2
1
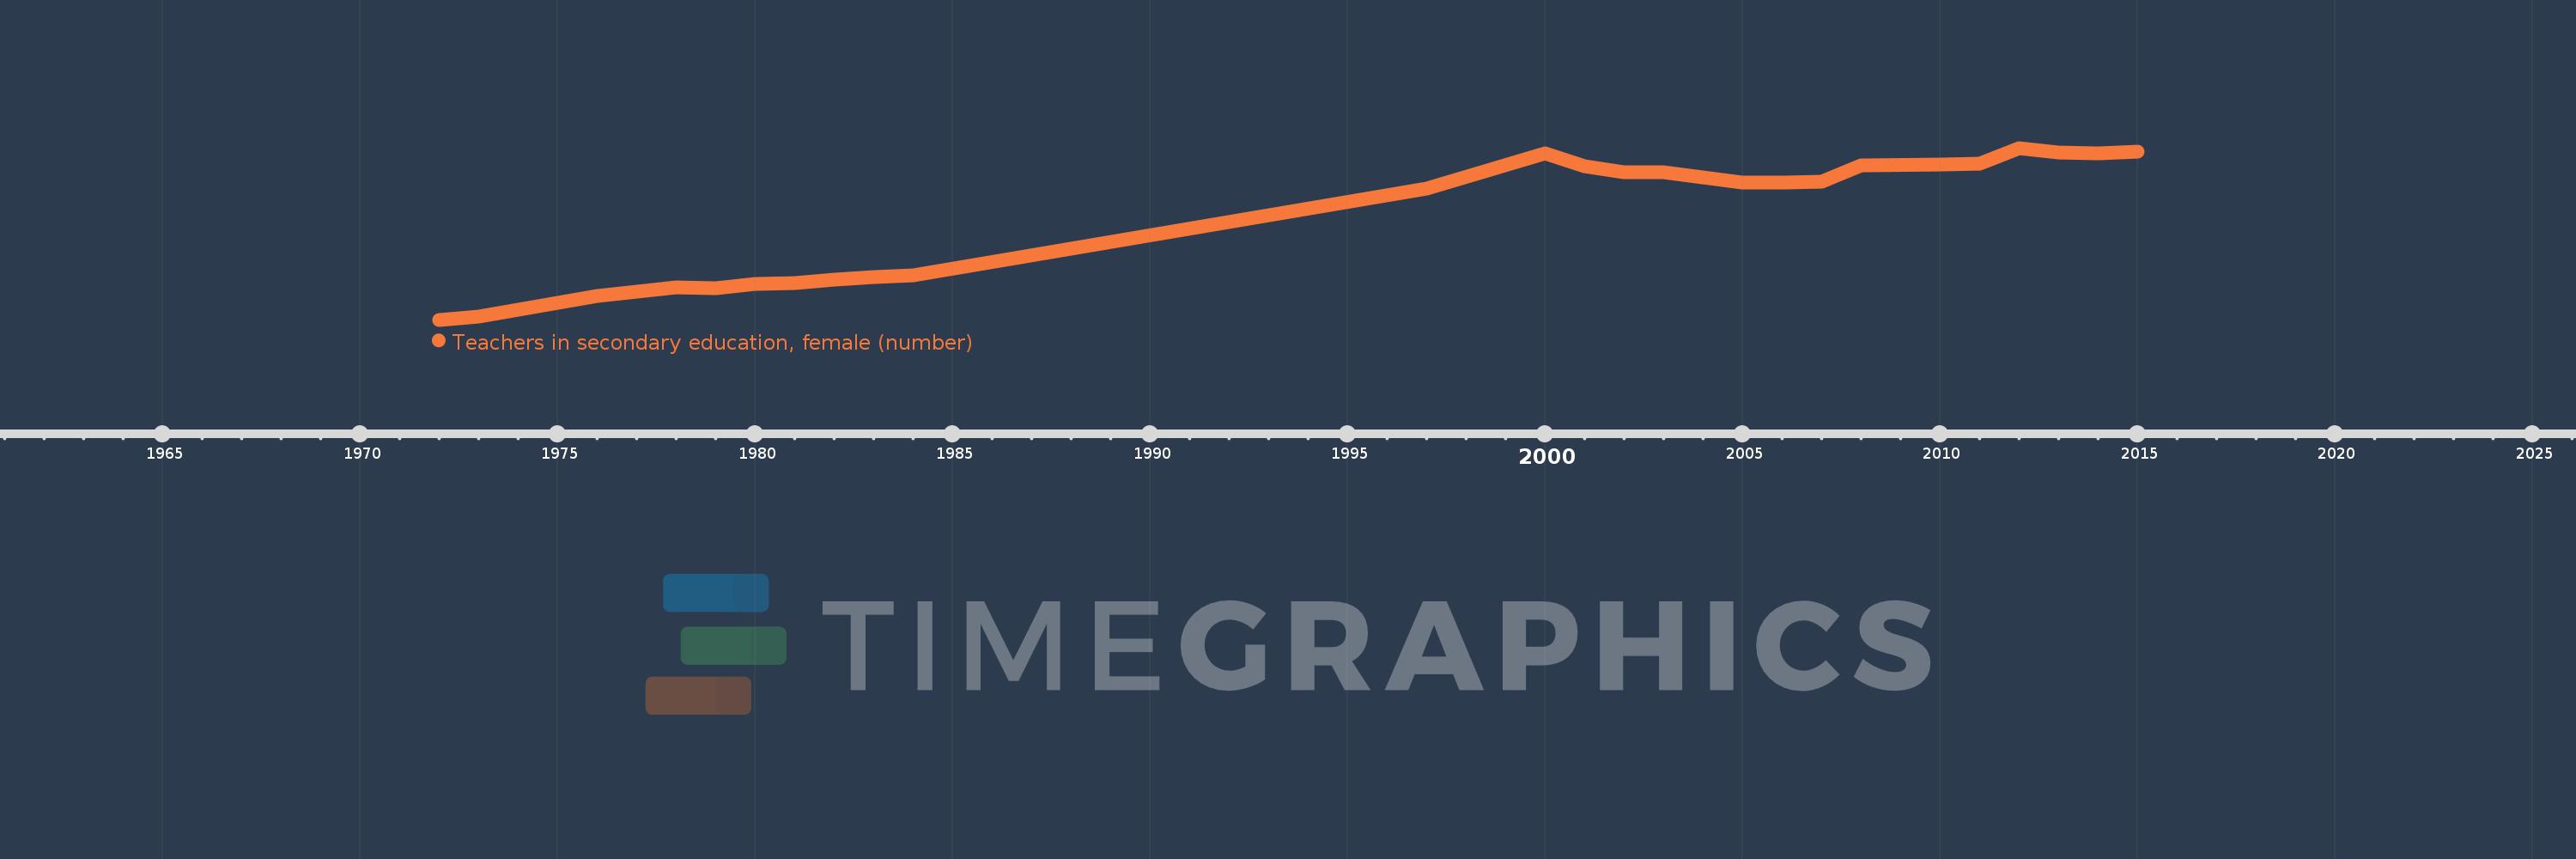
Teachers in secondary education, female (number)
2015,2014,2013,2012,2011,2010,2008,2007,2006,2005,2003,2002,2001,2000,1997,1984,1983,1982,1981,1980,1979,1978,1976,1973,1972