33
/
AIzaSyB4mHJ5NPEv-XzF7P6NDYXjlkCWaeKw5bc
November 30, 2025
105782
China
CHN
true
2
1
Community health workers (per 1,000 people)
2012,2011,2010,2009,2008,2007,2006,2005,2004,2002,2001,2000,1999,1998,1997,1996,1991
Create a timeline
Public Timelines
For education
For educational institutions
For teachers
For students
Cabinet
For educational institutions
For teachers
For students
Open cabinet
FAQ
Close
Create a timeline
Public timelines
FAQ
About & Feedback
Terms
Privacy
FAQ
Support 24/7
Cabinet
Get premium
Donate
Download
Global statistics library
→
China
→
Community health workers (per 1,000 people)
This statistics in other country:
Algeria
Australia
Bahrain
Bangladesh
Belize
Benin
Bhutan
Bolivia
Botswana
Burkina Faso
Burundi
Cabo Verde
Cambodia
Central African Republic
Chad
Chile
China
Comoros
Congo, Rep.
Costa Rica
Djibouti
East Asia & Pacific (excluding high income)
East Asia & Pacific (IDA & IBRD countries)
Equatorial Guinea
Estonia
Ethiopia
Gambia, The
Ghana
Grenada
Guinea
Guinea-Bissau
Guyana
India
Indonesia
Iran, Islamic Rep.
Iraq
Jamaica
Jordan
Late-demographic dividend
Liberia
Madagascar
Malawi
Malaysia
Maldives
Mali
Mauritania
Mauritius
Micronesia, Fed. Sts.
Mongolia
Myanmar
Nauru
Nepal
New Zealand
Nigeria
Pakistan
Panama
Papua New Guinea
Paraguay
Russian Federation
Rwanda
Sao Tome and Principe
Sierra Leone
South Africa
St. Kitts and Nevis
St. Vincent and the Grenadines
Sudan
Swaziland
Thailand
Timor-Leste
Togo
Uganda
United Kingdom
Vanuatu
Yemen, Rep.
Zambia
Zimbabwe
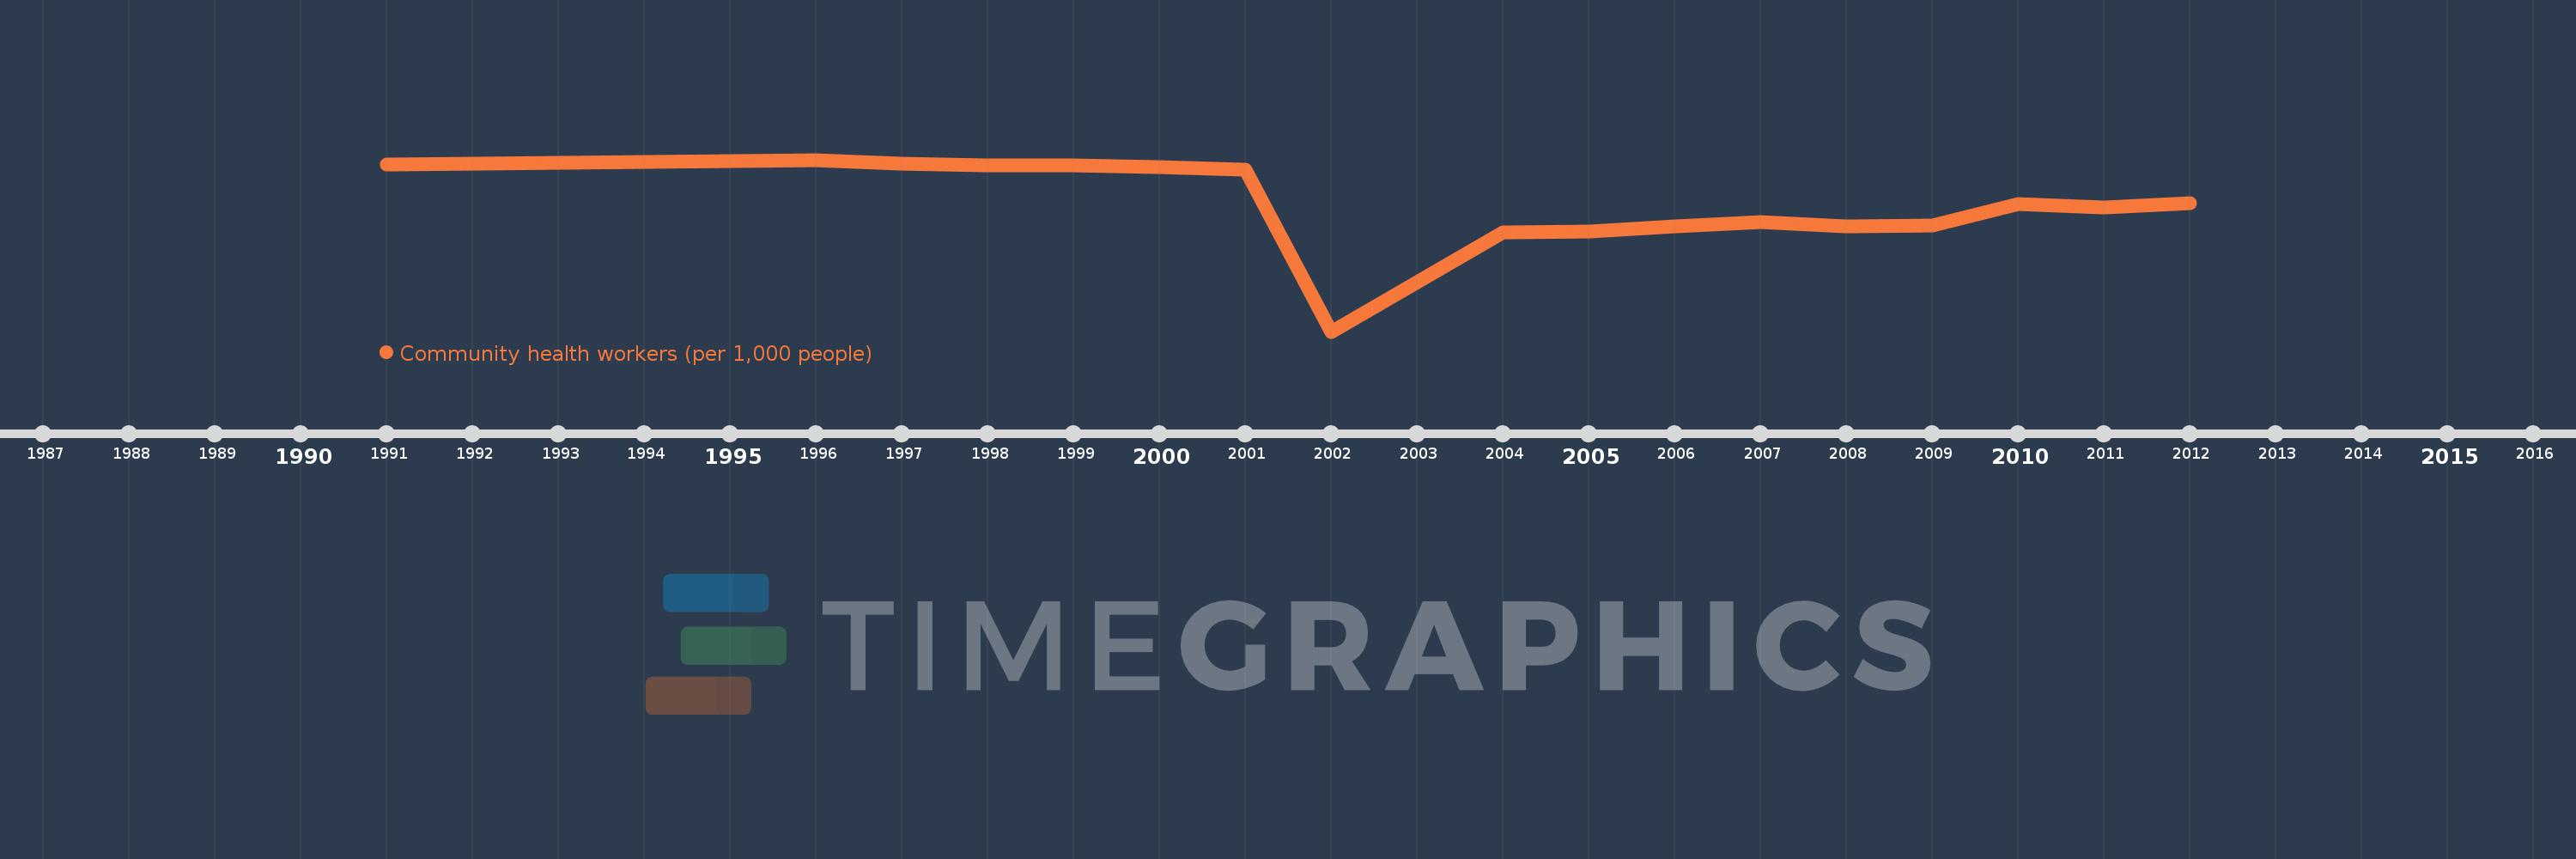
Timeline:
This timeline shows a graph from
1991
to
2012
of China. No data until
1990
. Number of actual observations by date:
17
.
Source name:
World Development Indicators
Source organization:
World Health Organization's Global Health Workforce Statistics, OECD, supplemented by country data.
Categories, topics:
Health, Climate Change
Last updated:
apr 23, 2017
Indicators value changes by year
Meaning:
0.829
Minimum:
0.084
jan 1, 2002
Maximum:
1.086
jan 1, 1996
At the date of observation
Value
Absolute change
Change from the previous value
jan 1, 1991
1.06
+1.06
0.0%
jan 1, 1996
1.086
+0.026
2.45%
jan 1, 1997
1.063
-0.023
-2.12%
jan 1, 1998
1.055
-0.008
-0.75%
jan 1, 1999
1.053
-0.002
-0.19%
jan 1, 2000
1.042
-0.011
-1.04%
jan 1, 2001
1.029
-0.013
-1.25%
jan 1, 2002
0.084
-0.945
-91.84%
jan 1, 2004
0.662
+0.578
688.1%
jan 1, 2005
0.669
+0.007
1.06%
jan 1, 2006
0.697
+0.028
4.19%
jan 1, 2007
0.723
+0.026
3.73%
jan 1, 2008
0.7
-0.023
-3.18%
jan 1, 2009
0.701
+0.001
0.14%
jan 1, 2010
0.827
+0.126
17.97%
jan 1, 2011
0.806
-0.021
-2.54%
jan 1, 2012
0.831
+0.025
3.1%
Ranking of countries by current statistics by years
About & Feedback
Terms
Privacy
FAQ
Support 24/7
Cabinet
Get premium
Donate
The service accepts bank transfer (ACH, Wire) or cards (Visa, MasterCard, etc). Processed by Stripe.
Secured with SSL