33
/pt/
AIzaSyAYiBZKx7MnpbEhh9jyipgxe19OcubqV5w
August 1, 2025
83019
Belize
BLZ
true
2
1
Lifetime risk of maternal death (%)
2016,2015,2014,2013,2012,2011,2010,2009,2008,2007,2006,2005,2004,2003,2002,2001,2000,1999,1998,1997,1996,1995,1994,1993,1992,1991
Download
Biblioteca de estatísticas globais →Belize →

Lifetime risk of maternal death (%)

Estas estatísticas em outros países:

AfghanistanAlbaniaAlgeriaAngolaArab WorldArgentinaArmeniaAustraliaAustriaAzerbaijanBahamas, TheBahrainBangladeshBarbadosBelarusBelgiumBelizeBeninBhutanBoliviaBosnia and HerzegovinaBotswanaBrazilBrunei DarussalamBulgariaBurkina FasoBurundiCabo VerdeCambodiaCameroonCanadaCaribbean small statesCentral African RepublicCentral Europe and the BalticsChadChileChinaColombiaComorosCongo, Dem. Rep.Congo, Rep.Costa RicaCote d'IvoireCroatiaCubaCyprusCzech RepublicDenmarkDjiboutiDominican RepublicEarly-demographic dividendEast Asia & PacificEast Asia & Pacific (excluding high income)East Asia & Pacific (IDA & IBRD countries)EcuadorEgypt, Arab Rep.El SalvadorEquatorial GuineaEritreaEstoniaEthiopiaEuro areaEurope & Central AsiaEurope & Central Asia (excluding high income)Europe & Central Asia (IDA & IBRD countries)European UnionFijiFinlandFragile and conflict affected situationsFranceGabonGambia, TheGeorgiaGermanyGhanaGreeceGrenadaGuatemalaGuineaGuinea-BissauGuyanaHaitiHeavily indebted poor countries (HIPC)High incomeHondurasHungaryIBRD onlyIcelandIDA & IBRD totalIDA blendIDA onlyIDA totalIndiaIndonesiaIran, Islamic Rep.IraqIrelandIsraelItalyJamaicaJapanJordanKazakhstanKenyaKiribatiKorea, Dem. People’s Rep.Korea, Rep.KuwaitKyrgyz RepublicLao PDRLate-demographic dividendLatin America & Caribbean Latin America & Caribbean (excluding high income)Latin America & the Caribbean (IDA & IBRD countries)LatviaLeast developed countries: UN classificationLebanonLesothoLiberiaLibyaLithuaniaLow & middle incomeLow incomeLower middle incomeLuxembourgMacedonia, FYRMadagascarMalawiMalaysiaMaldivesMaliMaltaMauritaniaMauritiusMexicoMicronesia, Fed. Sts.Middle East & North AfricaMiddle East & North Africa (excluding high income)Middle East & North Africa (IDA & IBRD countries)Middle incomeMoldovaMongoliaMontenegroMoroccoMozambiqueMyanmarNamibiaNepalNetherlandsNew ZealandNicaraguaNigerNigeriaNorth AmericaNorwayOECD membersOmanOther small statesPacific island small statesPakistanPanamaPapua New GuineaParaguayPeruPhilippinesPolandPortugalPost-demographic dividendPre-demographic dividendPuerto RicoQatarRomaniaRussian FederationRwandaSamoaSao Tome and PrincipeSaudi ArabiaSenegalSerbiaSierra LeoneSingaporeSlovak RepublicSloveniaSmall statesSolomon IslandsSomaliaSouth AfricaSouth AsiaSouth Asia (IDA & IBRD)South SudanSpainSri LankaSt. LuciaSt. Vincent and the GrenadinesSub-Saharan Africa Sub-Saharan Africa (excluding high income)Sub-Saharan Africa (IDA & IBRD countries)SudanSurinameSwazilandSwedenSwitzerlandSyrian Arab RepublicTajikistanTanzaniaThailandTimor-LesteTogoTongaTrinidad and TobagoTunisiaTurkeyTurkmenistanUgandaUkraineUnited Arab EmiratesUnited KingdomUnited StatesUpper middle incomeUruguayUzbekistanVanuatuVenezuela, RBVietnamWest Bank and GazaWorldYemen, Rep.ZambiaZimbabwe

Linha do tempo:

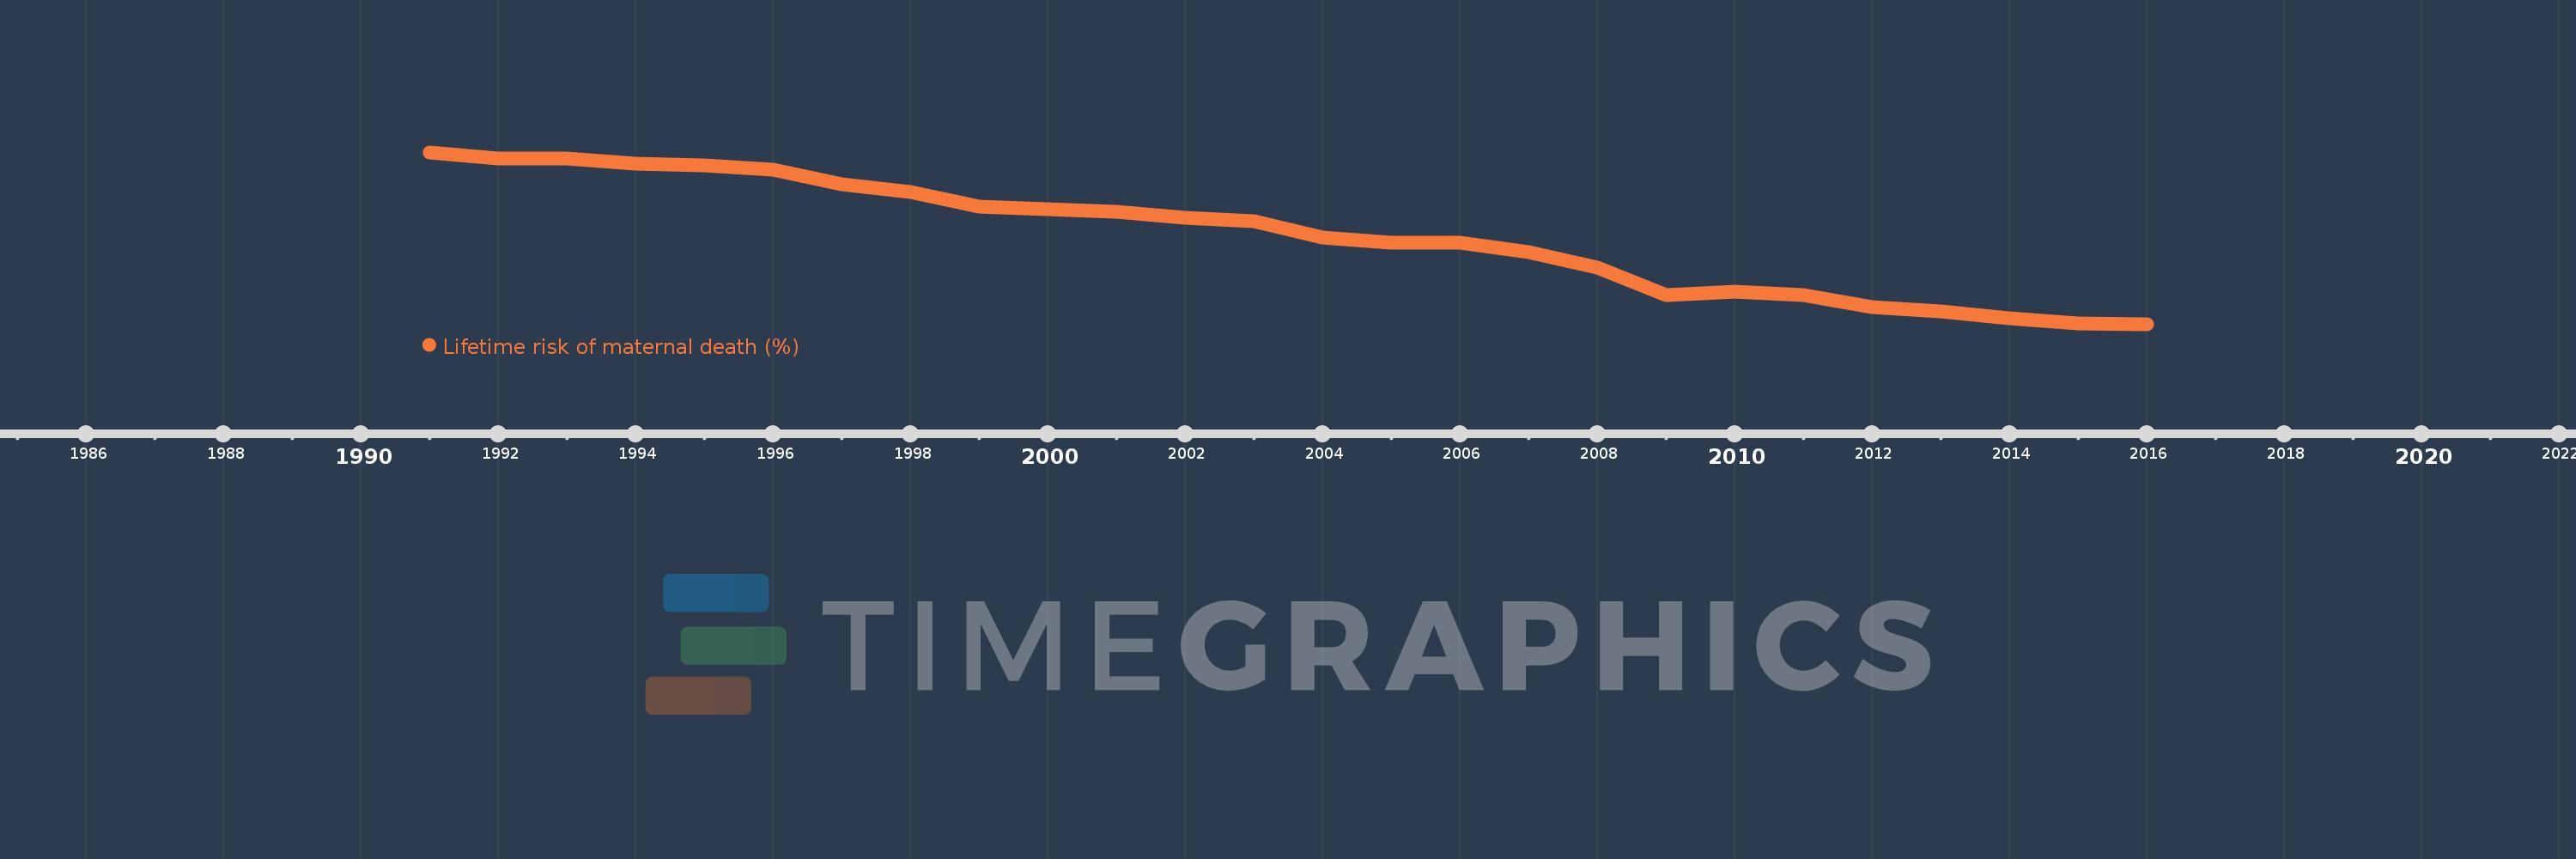
Nesta escala de tempo está apresentado um gráfico de 1991 ano até 2016 ano Belize. Dados de 1990 ano ausente. O número de observações reais por data: 26.

Fonte (nome):

Indicadores de desenvolvimento mundial

Fonte (organização):

WHO, UNICEF, UNFPA, The World Bank, and the United Nations Population Division. Trends in Maternal Mortality: 1990 to 2015. Geneva, World Health Organization, 2015

Categorias:

Health, Gender

Foi atualizado:

23 abr 2017 ano

Indicadores de alterações dos valores ao longo dos anos

Em média:
0.19
Mínimo:
0.079
1 jan 2016 ano
Máximo:
0.294
1 jan 1991 ano
Na data de observação
Valor
Mudança absoluta
A alteração em relação ao valor anterior
1 jan 1991 ano
0.294
+0.294
0.0%
1 jan 1992 ano
0.286
-0.008
-2.74%
1 jan 1993 ano
0.286
+0.001
0.18%
1 jan 1994 ano
0.28
-0.007
-2.27%
1 jan 1995 ano
0.278
-0.002
-0.64%
1 jan 1996 ano
0.272
-0.006
-2.19%
1 jan 1997 ano
0.254
-0.018
-6.66%
1 jan 1998 ano
0.244
-0.01
-3.9%
1 jan 1999 ano
0.226
-0.018
-7.36%
1 jan 2000 ano
0.223
-0.003
-1.37%
1 jan 2001 ano
0.22
-0.003
-1.53%
1 jan 2002 ano
0.212
-0.008
-3.61%
1 jan 2003 ano
0.208
-0.003
-1.57%
1 jan 2004 ano
0.188
-0.021
-9.93%
1 jan 2005 ano
0.181
-0.007
-3.76%
1 jan 2006 ano
0.181
+0.0
0.03%
1 jan 2007 ano
0.169
-0.011
-6.33%
1 jan 2008 ano
0.15
-0.019
-11.14%
1 jan 2009 ano
0.115
-0.035
-23.52%
1 jan 2010 ano
0.12
+0.005
4.57%
1 jan 2011 ano
0.115
-0.005
-4.56%
1 jan 2012 ano
0.1
-0.015
-12.82%
1 jan 2013 ano
0.095
-0.005
-5.15%
1 jan 2014 ano
0.086
-0.009
-9.31%
1 jan 2015 ano
0.08
-0.006
-6.85%
1 jan 2016 ano
0.079
-0.001
-1.28%

Classificação de países por estatísticas atuais por anos