29
/pt/
pt
AIzaSyAYiBZKx7MnpbEhh9jyipgxe19OcubqV5w
April 1, 2024
280008
Vanuatu
VUT
true
2
1
Lifetime risk of maternal death (%)
2016,2015,2014,2013,2012,2011,2010,2009,2008,2007,2006,2005,2004,2003,2002,2001,2000,1999,1998,1997,1996,1995,1994,1993,1992,1991
Download
Biblioteca de estatísticas globais →Vanuatu →

Lifetime risk of maternal death (%)

Estas estatísticas em outros países:
AfghanistanAlbaniaAlgeriaAngolaArab WorldArgentinaArmeniaAustraliaAustriaAzerbaijanBahamas, TheBahrainBangladeshBarbadosBelarusBelgiumBelizeBeninBhutanBoliviaBosnia and HerzegovinaBotswanaBrazilBrunei DarussalamBulgariaBurkina FasoBurundiCabo VerdeCambodiaCameroonCanadaCaribbean small statesCentral African RepublicCentral Europe and the BalticsChadChileChinaColombiaComorosCongo, Dem. Rep.Congo, Rep.Costa RicaCote d'IvoireCroatiaCubaCyprusCzech RepublicDenmarkDjiboutiDominican RepublicEarly-demographic dividendEast Asia & PacificEast Asia & Pacific (excluding high income)East Asia & Pacific (IDA & IBRD countries)EcuadorEgypt, Arab Rep.El SalvadorEquatorial GuineaEritreaEstoniaEthiopiaEuro areaEurope & Central AsiaEurope & Central Asia (excluding high income)Europe & Central Asia (IDA & IBRD countries)European UnionFijiFinlandFragile and conflict affected situationsFranceGabonGambia, TheGeorgiaGermanyGhanaGreeceGrenadaGuatemalaGuineaGuinea-BissauGuyanaHaitiHeavily indebted poor countries (HIPC)High incomeHondurasHungaryIBRD onlyIcelandIDA & IBRD totalIDA blendIDA onlyIDA totalIndiaIndonesiaIran, Islamic Rep.IraqIrelandIsraelItalyJamaicaJapanJordanKazakhstanKenyaKiribatiKorea, Dem. People’s Rep.Korea, Rep.KuwaitKyrgyz RepublicLao PDRLate-demographic dividendLatin America & Caribbean Latin America & Caribbean (excluding high income)Latin America & the Caribbean (IDA & IBRD countries)LatviaLeast developed countries: UN classificationLebanonLesothoLiberiaLibyaLithuaniaLow & middle incomeLow incomeLower middle incomeLuxembourgMacedonia, FYRMadagascarMalawiMalaysiaMaldivesMaliMaltaMauritaniaMauritiusMexicoMicronesia, Fed. Sts.Middle East & North AfricaMiddle East & North Africa (excluding high income)Middle East & North Africa (IDA & IBRD countries)Middle incomeMoldovaMongoliaMontenegroMoroccoMozambiqueMyanmarNamibiaNepalNetherlandsNew ZealandNicaraguaNigerNigeriaNorth AmericaNorwayOECD membersOmanOther small statesPacific island small statesPakistanPanamaPapua New GuineaParaguayPeruPhilippinesPolandPortugalPost-demographic dividendPre-demographic dividendPuerto RicoQatarRomaniaRussian FederationRwandaSamoaSao Tome and PrincipeSaudi ArabiaSenegalSerbiaSierra LeoneSingaporeSlovak RepublicSloveniaSmall statesSolomon IslandsSomaliaSouth AfricaSouth AsiaSouth Asia (IDA & IBRD)South SudanSpainSri LankaSt. LuciaSt. Vincent and the GrenadinesSub-Saharan Africa Sub-Saharan Africa (excluding high income)Sub-Saharan Africa (IDA & IBRD countries)SudanSurinameSwazilandSwedenSwitzerlandSyrian Arab RepublicTajikistanTanzaniaThailandTimor-LesteTogoTongaTrinidad and TobagoTunisiaTurkeyTurkmenistanUgandaUkraineUnited Arab EmiratesUnited KingdomUnited StatesUpper middle incomeUruguayUzbekistanVanuatuVenezuela, RBVietnamWest Bank and GazaWorldYemen, Rep.ZambiaZimbabwe
Linha do tempo:
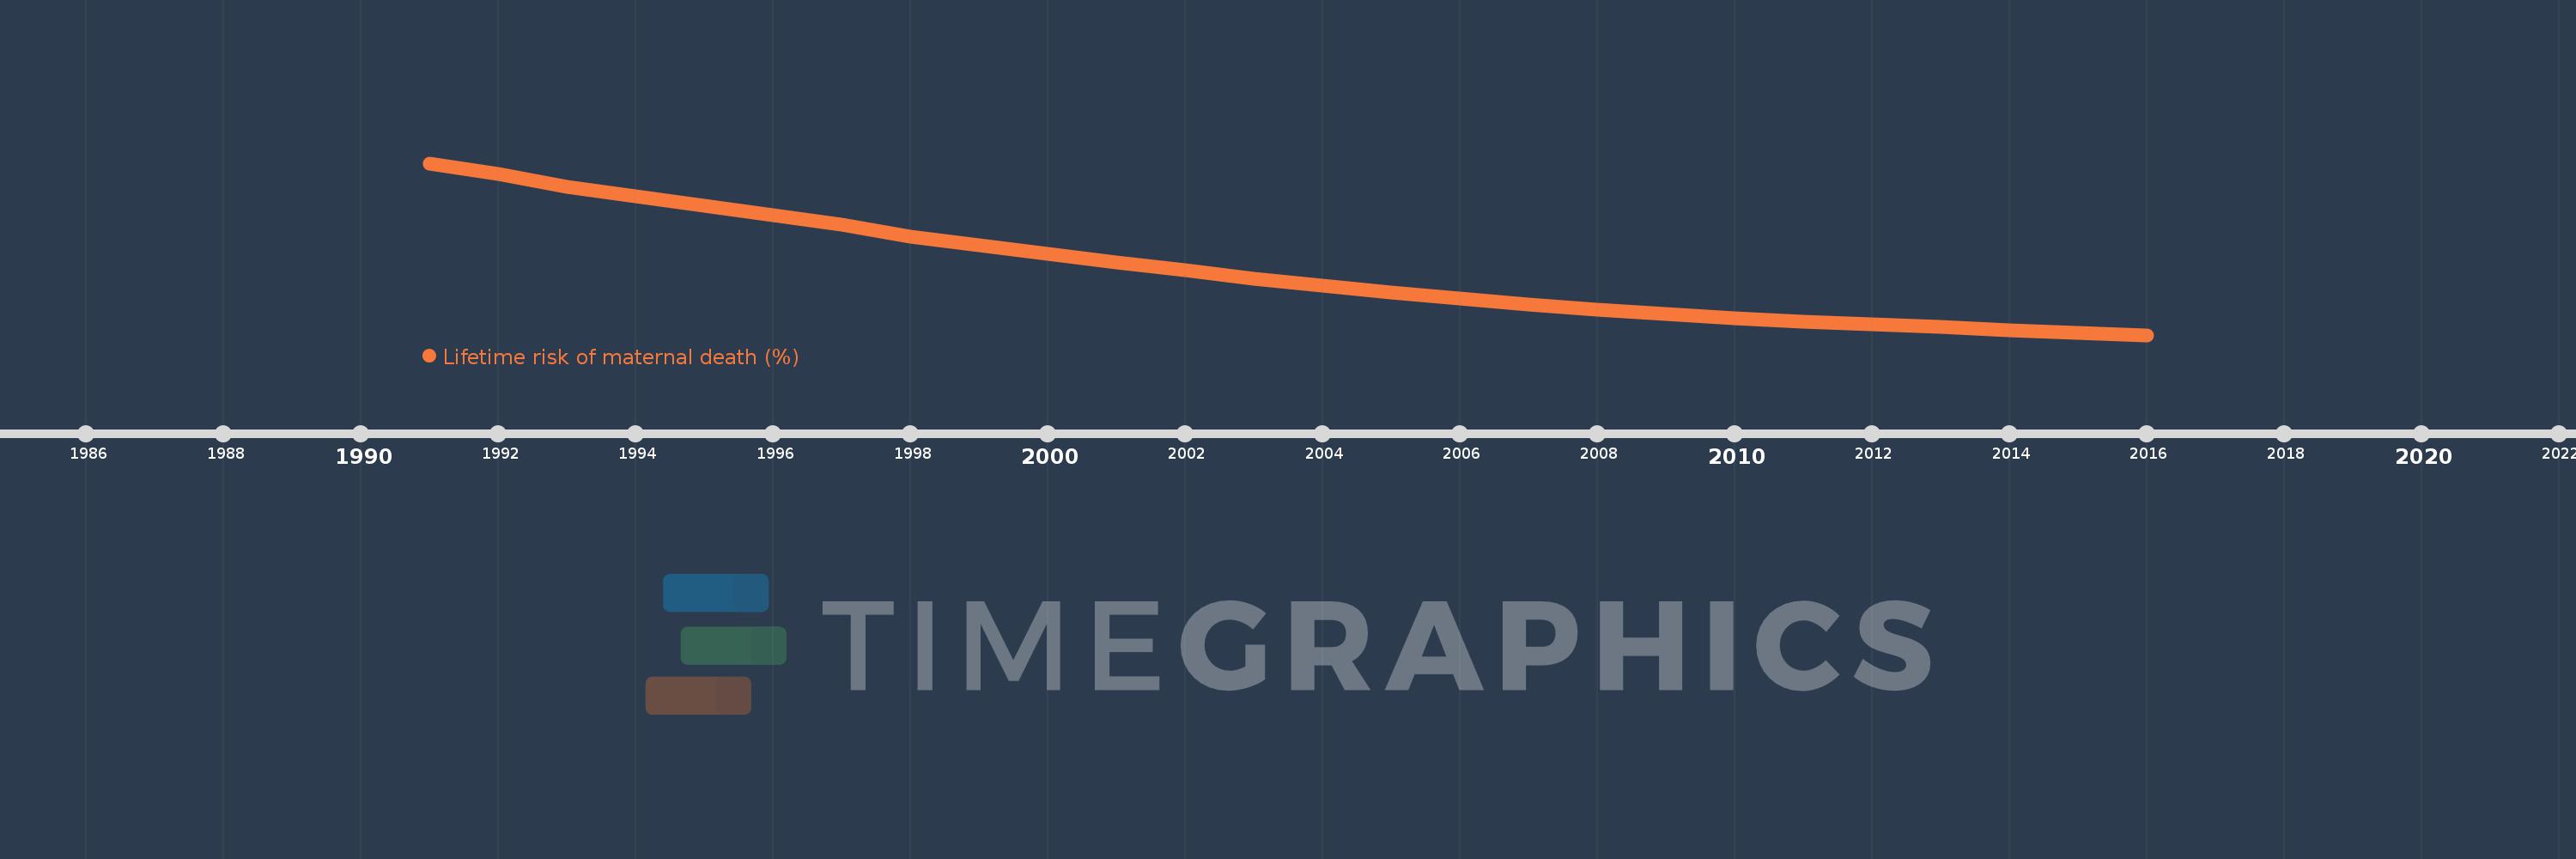
Nesta escala de tempo está apresentado um gráfico de 1991 ano até 2016 ano Vanuatu. Dados de 1990 ano ausente. O número de observações reais por data: 26.
Fonte (nome):
Indicadores de desenvolvimento mundial
Fonte (organização):
WHO, UNICEF, UNFPA, The World Bank, and the United Nations Population Division. Trends in Maternal Mortality: 1990 to 2015. Geneva, World Health Organization, 2015
Categorias:
Health, Gender
Foi atualizado:
23 abr 2017 ano
Indicadores de alterações dos valores ao longo dos anos
Em média:
0.625
Mínimo:
0.281
1 jan 2016 ano
Máximo:
1.182
1 jan 1991 ano
Na data de observação
Valor
Mudança absoluta
A alteração em relação ao valor anterior
1 jan 1991 ano
1.182
+1.182
0.0%
1 jan 1992 ano
1.127
-0.055
-4.67%
1 jan 1993 ano
1.059
-0.068
-6.07%
1 jan 1994 ano
1.008
-0.051
-4.79%
1 jan 1995 ano
0.96
-0.047
-4.7%
1 jan 1996 ano
0.91
-0.05
-5.22%
1 jan 1997 ano
0.858
-0.053
-5.78%
1 jan 1998 ano
0.799
-0.059
-6.86%
1 jan 1999 ano
0.751
-0.048
-5.99%
1 jan 2000 ano
0.705
-0.046
-6.13%
1 jan 2001 ano
0.663
-0.042
-5.98%
1 jan 2002 ano
0.619
-0.044
-6.64%
1 jan 2003 ano
0.577
-0.041
-6.68%
1 jan 2004 ano
0.541
-0.036
-6.29%
1 jan 2005 ano
0.505
-0.037
-6.75%
1 jan 2006 ano
0.473
-0.032
-6.3%
1 jan 2007 ano
0.439
-0.034
-7.13%
1 jan 2008 ano
0.412
-0.027
-6.21%
1 jan 2009 ano
0.39
-0.022
-5.39%
1 jan 2010 ano
0.371
-0.018
-4.7%
1 jan 2011 ano
0.353
-0.018
-4.96%
1 jan 2012 ano
0.339
-0.014
-4.0%
1 jan 2013 ano
0.322
-0.017
-4.9%
1 jan 2014 ano
0.306
-0.016
-5.08%
1 jan 2015 ano
0.293
-0.013
-4.31%
1 jan 2016 ano
0.281
-0.011
-3.85%
Classificação de países por estatísticas atuais por anos

Comentários:

Enviar
PremiumAbout & FeedbackAcordoPrivacidade
logo
© 2022 Selected Technologies LLC – Morgan Hill, California