33
/pt/
AIzaSyAYiBZKx7MnpbEhh9jyipgxe19OcubqV5w
August 1, 2025
236005
Senegal
SEN
true
2
1
Lifetime risk of maternal death (%)
2016,2015,2014,2013,2012,2011,2010,2009,2008,2007,2006,2005,2004,2003,2002,2001,2000,1999,1998,1997,1996,1995,1994,1993,1992,1991
Download
Biblioteca de estatísticas globais →Senegal →

Lifetime risk of maternal death (%)

Estas estatísticas em outros países:

AfghanistanAlbaniaAlgeriaAngolaArab WorldArgentinaArmeniaAustraliaAustriaAzerbaijanBahamas, TheBahrainBangladeshBarbadosBelarusBelgiumBelizeBeninBhutanBoliviaBosnia and HerzegovinaBotswanaBrazilBrunei DarussalamBulgariaBurkina FasoBurundiCabo VerdeCambodiaCameroonCanadaCaribbean small statesCentral African RepublicCentral Europe and the BalticsChadChileChinaColombiaComorosCongo, Dem. Rep.Congo, Rep.Costa RicaCote d'IvoireCroatiaCubaCyprusCzech RepublicDenmarkDjiboutiDominican RepublicEarly-demographic dividendEast Asia & PacificEast Asia & Pacific (excluding high income)East Asia & Pacific (IDA & IBRD countries)EcuadorEgypt, Arab Rep.El SalvadorEquatorial GuineaEritreaEstoniaEthiopiaEuro areaEurope & Central AsiaEurope & Central Asia (excluding high income)Europe & Central Asia (IDA & IBRD countries)European UnionFijiFinlandFragile and conflict affected situationsFranceGabonGambia, TheGeorgiaGermanyGhanaGreeceGrenadaGuatemalaGuineaGuinea-BissauGuyanaHaitiHeavily indebted poor countries (HIPC)High incomeHondurasHungaryIBRD onlyIcelandIDA & IBRD totalIDA blendIDA onlyIDA totalIndiaIndonesiaIran, Islamic Rep.IraqIrelandIsraelItalyJamaicaJapanJordanKazakhstanKenyaKiribatiKorea, Dem. People’s Rep.Korea, Rep.KuwaitKyrgyz RepublicLao PDRLate-demographic dividendLatin America & Caribbean Latin America & Caribbean (excluding high income)Latin America & the Caribbean (IDA & IBRD countries)LatviaLeast developed countries: UN classificationLebanonLesothoLiberiaLibyaLithuaniaLow & middle incomeLow incomeLower middle incomeLuxembourgMacedonia, FYRMadagascarMalawiMalaysiaMaldivesMaliMaltaMauritaniaMauritiusMexicoMicronesia, Fed. Sts.Middle East & North AfricaMiddle East & North Africa (excluding high income)Middle East & North Africa (IDA & IBRD countries)Middle incomeMoldovaMongoliaMontenegroMoroccoMozambiqueMyanmarNamibiaNepalNetherlandsNew ZealandNicaraguaNigerNigeriaNorth AmericaNorwayOECD membersOmanOther small statesPacific island small statesPakistanPanamaPapua New GuineaParaguayPeruPhilippinesPolandPortugalPost-demographic dividendPre-demographic dividendPuerto RicoQatarRomaniaRussian FederationRwandaSamoaSao Tome and PrincipeSaudi ArabiaSenegalSerbiaSierra LeoneSingaporeSlovak RepublicSloveniaSmall statesSolomon IslandsSomaliaSouth AfricaSouth AsiaSouth Asia (IDA & IBRD)South SudanSpainSri LankaSt. LuciaSt. Vincent and the GrenadinesSub-Saharan Africa Sub-Saharan Africa (excluding high income)Sub-Saharan Africa (IDA & IBRD countries)SudanSurinameSwazilandSwedenSwitzerlandSyrian Arab RepublicTajikistanTanzaniaThailandTimor-LesteTogoTongaTrinidad and TobagoTunisiaTurkeyTurkmenistanUgandaUkraineUnited Arab EmiratesUnited KingdomUnited StatesUpper middle incomeUruguayUzbekistanVanuatuVenezuela, RBVietnamWest Bank and GazaWorldYemen, Rep.ZambiaZimbabwe

Linha do tempo:

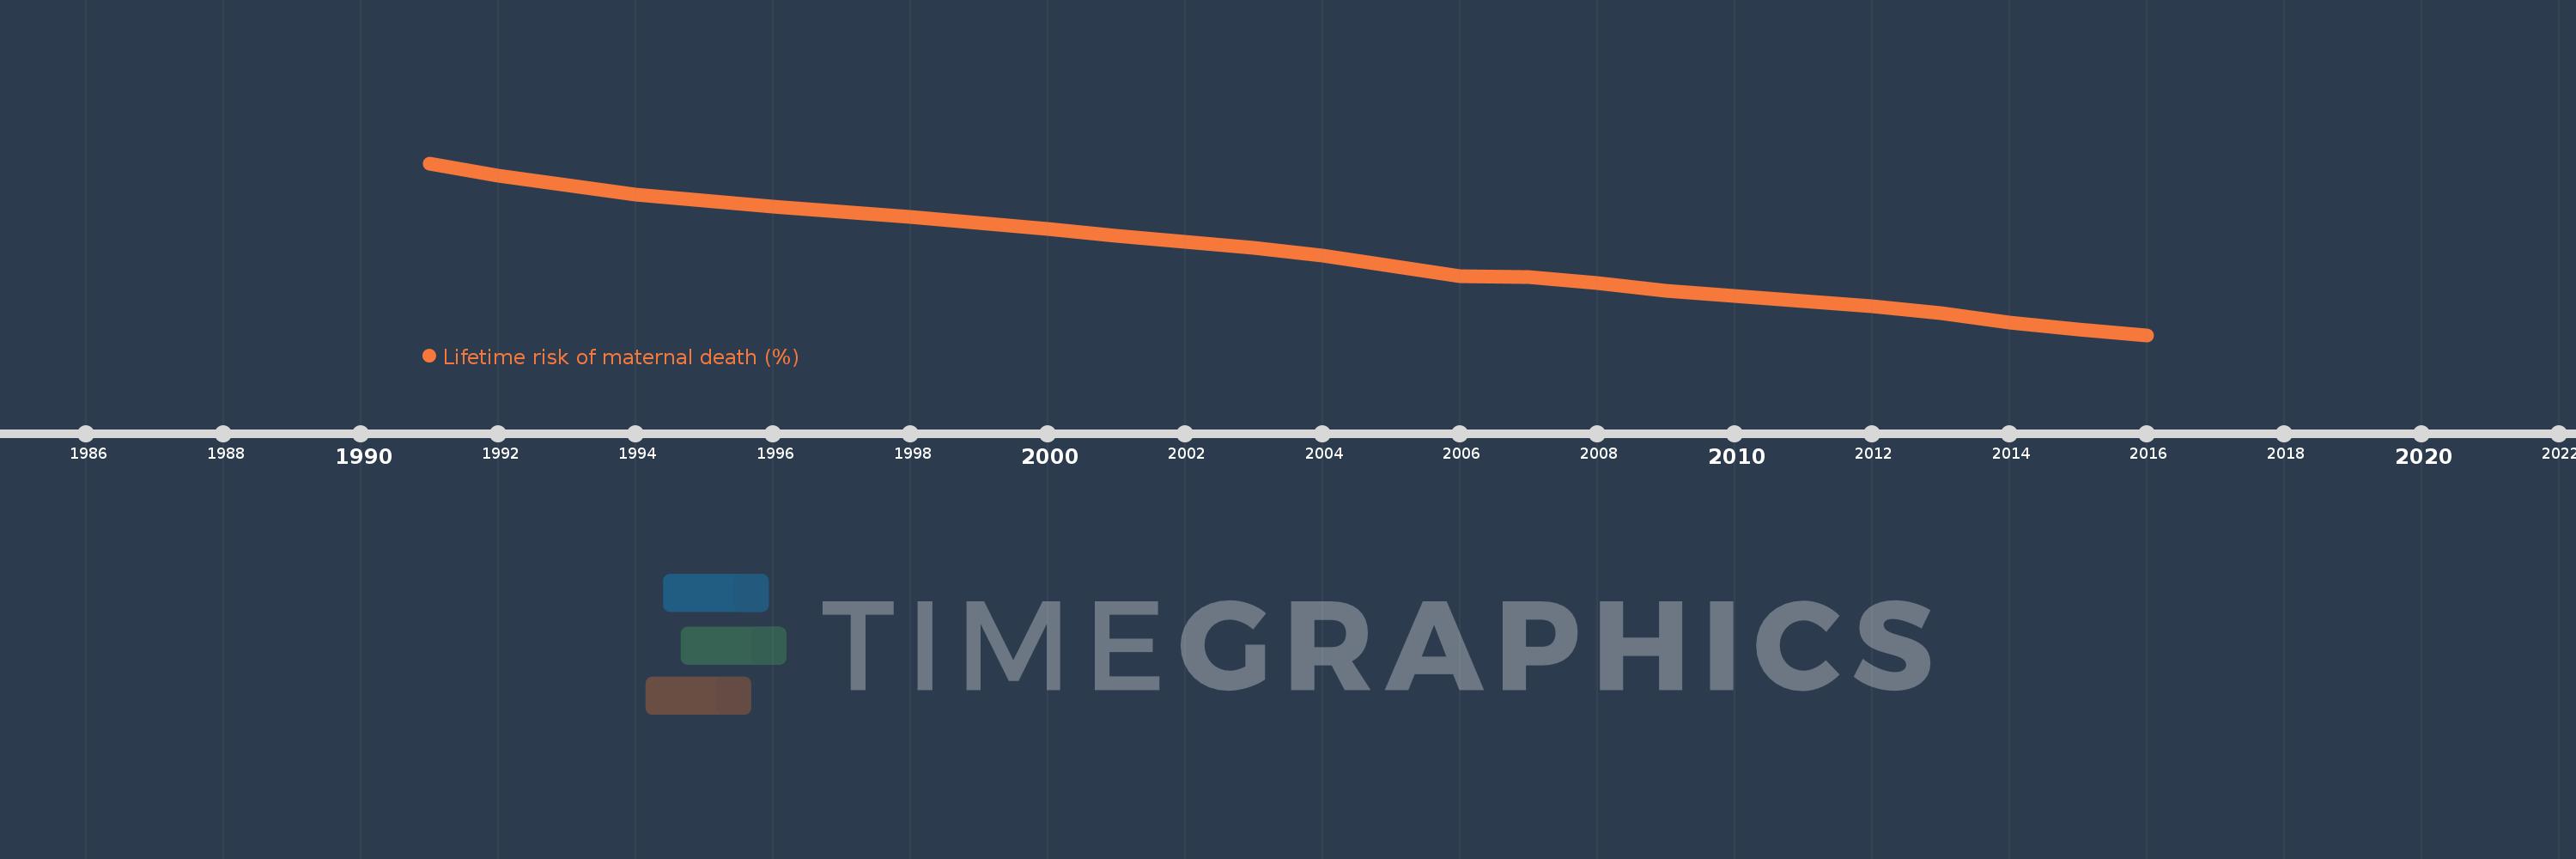
Nesta escala de tempo está apresentado um gráfico de 1991 ano até 2016 ano Senegal. Dados de 1990 ano ausente. O número de observações reais por data: 26.

Fonte (nome):

Indicadores de desenvolvimento mundial

Fonte (organização):

WHO, UNICEF, UNFPA, The World Bank, and the United Nations Population Division. Trends in Maternal Mortality: 1990 to 2015. Geneva, World Health Organization, 2015

Categorias:

Health, Gender

Foi atualizado:

23 abr 2017 ano

Indicadores de alterações dos valores ao longo dos anos

Em média:
2.565
Mínimo:
1.633
1 jan 2016 ano
Máximo:
3.588
1 jan 1991 ano
Na data de observação
Valor
Mudança absoluta
A alteração em relação ao valor anterior
1 jan 1991 ano
3.588
+3.588
0.0%
1 jan 1992 ano
3.449
-0.138
-3.86%
1 jan 1993 ano
3.342
-0.107
-3.11%
1 jan 1994 ano
3.236
-0.106
-3.18%
1 jan 1995 ano
3.164
-0.072
-2.23%
1 jan 1996 ano
3.093
-0.07
-2.22%
1 jan 1997 ano
3.039
-0.055
-1.77%
1 jan 1998 ano
2.98
-0.058
-1.92%
1 jan 1999 ano
2.912
-0.068
-2.29%
1 jan 2000 ano
2.842
-0.07
-2.4%
1 jan 2001 ano
2.763
-0.079
-2.78%
1 jan 2002 ano
2.691
-0.072
-2.62%
1 jan 2003 ano
2.625
-0.066
-2.45%
1 jan 2004 ano
2.535
-0.09
-3.43%
1 jan 2005 ano
2.417
-0.117
-4.62%
1 jan 2006 ano
2.306
-0.112
-4.62%
1 jan 2007 ano
2.293
-0.013
-0.55%
1 jan 2008 ano
2.222
-0.071
-3.08%
1 jan 2009 ano
2.141
-0.081
-3.65%
1 jan 2010 ano
2.08
-0.062
-2.88%
1 jan 2011 ano
2.017
-0.062
-3.0%
1 jan 2012 ano
1.958
-0.059
-2.92%
1 jan 2013 ano
1.879
-0.079
-4.04%
1 jan 2014 ano
1.778
-0.101
-5.4%
1 jan 2015 ano
1.7
-0.078
-4.37%
1 jan 2016 ano
1.633
-0.067
-3.93%

Classificação de países por estatísticas atuais por anos