30
/pt/
AIzaSyAYiBZKx7MnpbEhh9jyipgxe19OcubqV5w
April 1, 2024
81336
Belarus
BLR
true
2
1
Total debt service (% of GNI)
2016,2015,2014,2013,2012,2011,2010,2009,2008,2007,2006,2005,2004,2003,2002,2001,2000,1999,1998,1997,1996,1995,1994
Download
Biblioteca de estatísticas globais →Belarus →

Total debt service (% of GNI)

Estas estatísticas em outros países:

AfghanistanAlbaniaAlgeriaAngolaArab WorldArgentinaArmeniaAzerbaijanBangladeshBelarusBelizeBeninBhutanBoliviaBosnia and HerzegovinaBotswanaBrazilBulgariaBurkina FasoBurundiCabo VerdeCambodiaCameroonCentral African RepublicCentral Europe and the BalticsChadChinaColombiaComorosCongo, Dem. Rep.Congo, Rep.Costa RicaCote d'IvoireDjiboutiDominicaDominican RepublicEarly-demographic dividendEast Asia & Pacific (excluding high income)East Asia & Pacific (IDA & IBRD countries)EcuadorEgypt, Arab Rep.El SalvadorEritreaEthiopiaEurope & Central Asia (excluding high income)Europe & Central Asia (IDA & IBRD countries)FijiFragile and conflict affected situationsGabonGambia, TheGeorgiaGhanaGrenadaGuatemalaGuineaGuinea-BissauGuyanaHaitiHeavily indebted poor countries (HIPC)HondurasIBRD onlyIDA & IBRD totalIDA blendIDA onlyIDA totalIndiaIndonesiaIran, Islamic Rep.JamaicaJordanKazakhstanKenyaKosovoKyrgyz RepublicLao PDRLate-demographic dividendLatin America & Caribbean Latin America & Caribbean (excluding high income)Latin America & the Caribbean (IDA & IBRD countries)Least developed countries: UN classificationLebanonLesothoLiberiaLow & middle incomeLow incomeLower middle incomeMacedonia, FYRMadagascarMalawiMalaysiaMaldivesMaliMauritaniaMauritiusMexicoMiddle East & North Africa (excluding high income)Middle East & North Africa (IDA & IBRD countries)Middle incomeMoldovaMongoliaMontenegroMoroccoMozambiqueMyanmarNepalNicaraguaNigerNigeriaPacific island small statesPakistanPanamaPapua New GuineaParaguayPeruPhilippinesPre-demographic dividendRomaniaRussian FederationRwandaSamoaSao Tome and PrincipeSenegalSerbiaSierra LeoneSolomon IslandsSomaliaSouth AfricaSouth AsiaSouth Asia (IDA & IBRD)Sri LankaSt. LuciaSt. Vincent and the GrenadinesSub-Saharan Africa Sub-Saharan Africa (excluding high income)Sub-Saharan Africa (IDA & IBRD countries)SudanSwazilandSyrian Arab RepublicTajikistanTanzaniaThailandTogoTongaTunisiaTurkeyTurkmenistanUgandaUkraineUpper middle incomeUzbekistanVanuatuVenezuela, RBVietnamYemen, Rep.ZambiaZimbabwe

Linha do tempo:

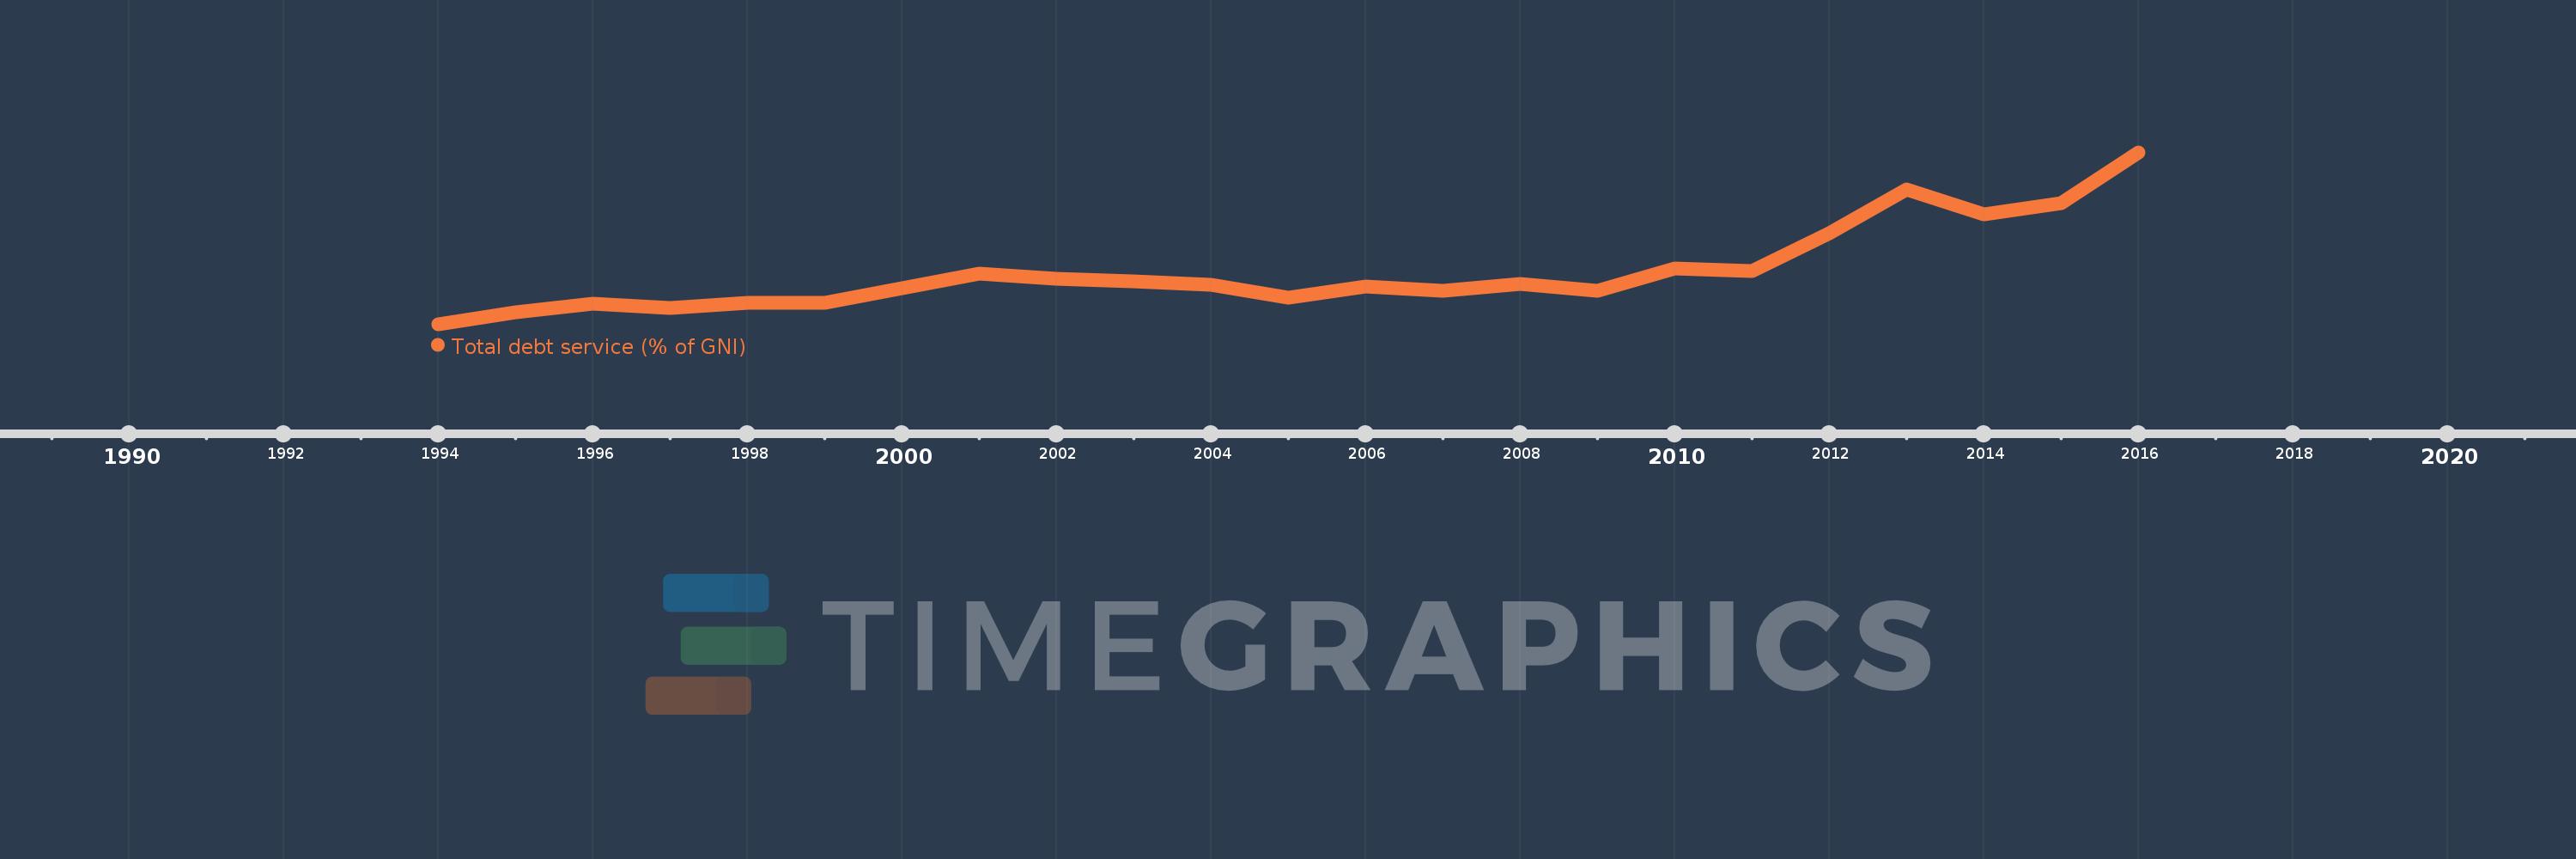
Nesta escala de tempo está apresentado um gráfico de 1994 ano até 2016 ano Belarus. Dados de 1993 ano ausente. O número de observações reais por data: 23.

Fonte (nome):

Indicadores de desenvolvimento mundial

Fonte (organização):

World Bank, International Debt Statistics.

Categorias:

Economy & Growth, External Debt

Foi atualizado:

23 abr 2017 ano

Indicadores de alterações dos valores ao longo dos anos

Em média:
3.199
Mínimo:
0.085
1 jan 1994 ano
Máximo:
10.217
1 jan 2016 ano
Na data de observação
Valor
Mudança absoluta
A alteração em relação ao valor anterior
1 jan 1994 ano
0.085
+0.085
0.0%
1 jan 1995 ano
0.793
+0.708
830.73%
1 jan 1996 ano
1.303
+0.51
64.34%
1 jan 1997 ano
1.059
-0.244
-18.73%
1 jan 1998 ano
1.361
+0.302
28.54%
1 jan 1999 ano
1.332
-0.03
-2.19%
1 jan 2000 ano
2.23
+0.898
67.46%
1 jan 2001 ano
3.071
+0.841
37.71%
1 jan 2002 ano
2.749
-0.322
-10.47%
1 jan 2003 ano
2.598
-0.152
-5.51%
1 jan 2004 ano
2.395
-0.203
-7.81%
1 jan 2005 ano
1.659
-0.736
-30.73%
1 jan 2006 ano
2.315
+0.656
39.52%
1 jan 2007 ano
2.042
-0.272
-11.76%
1 jan 2008 ano
2.451
+0.409
20.03%
1 jan 2009 ano
2.031
-0.421
-17.16%
1 jan 2010 ano
3.35
+1.319
64.97%
1 jan 2011 ano
3.223
-0.128
-3.81%
1 jan 2012 ano
5.468
+2.245
69.66%
1 jan 2013 ano
8.026
+2.558
46.78%
1 jan 2014 ano
6.589
-1.436
-17.9%
1 jan 2015 ano
7.241
+0.652
9.9%
1 jan 2016 ano
10.217
+2.976
41.1%

Classificação de países por estatísticas atuais por anos