33
/pt/
AIzaSyAYiBZKx7MnpbEhh9jyipgxe19OcubqV5w
May 1, 2025
279408
Uzbekistan
UZB
true
2
1
Total debt service (% of GNI)
2016,2015,2014,2013,2012,2011,2010,2009,2008,2007,2006,2005,2004,2003,2002,2001,2000,1999,1998,1997,1996,1995,1994,1993
Download
Biblioteca de estatísticas globais →Uzbekistan →

Total debt service (% of GNI)

Estas estatísticas em outros países:

AfghanistanAlbaniaAlgeriaAngolaArab WorldArgentinaArmeniaAzerbaijanBangladeshBelarusBelizeBeninBhutanBoliviaBosnia and HerzegovinaBotswanaBrazilBulgariaBurkina FasoBurundiCabo VerdeCambodiaCameroonCentral African RepublicCentral Europe and the BalticsChadChinaColombiaComorosCongo, Dem. Rep.Congo, Rep.Costa RicaCote d'IvoireDjiboutiDominicaDominican RepublicEarly-demographic dividendEast Asia & Pacific (excluding high income)East Asia & Pacific (IDA & IBRD countries)EcuadorEgypt, Arab Rep.El SalvadorEritreaEthiopiaEurope & Central Asia (excluding high income)Europe & Central Asia (IDA & IBRD countries)FijiFragile and conflict affected situationsGabonGambia, TheGeorgiaGhanaGrenadaGuatemalaGuineaGuinea-BissauGuyanaHaitiHeavily indebted poor countries (HIPC)HondurasIBRD onlyIDA & IBRD totalIDA blendIDA onlyIDA totalIndiaIndonesiaIran, Islamic Rep.JamaicaJordanKazakhstanKenyaKosovoKyrgyz RepublicLao PDRLate-demographic dividendLatin America & Caribbean Latin America & Caribbean (excluding high income)Latin America & the Caribbean (IDA & IBRD countries)Least developed countries: UN classificationLebanonLesothoLiberiaLow & middle incomeLow incomeLower middle incomeMacedonia, FYRMadagascarMalawiMalaysiaMaldivesMaliMauritaniaMauritiusMexicoMiddle East & North Africa (excluding high income)Middle East & North Africa (IDA & IBRD countries)Middle incomeMoldovaMongoliaMontenegroMoroccoMozambiqueMyanmarNepalNicaraguaNigerNigeriaPacific island small statesPakistanPanamaPapua New GuineaParaguayPeruPhilippinesPre-demographic dividendRomaniaRussian FederationRwandaSamoaSao Tome and PrincipeSenegalSerbiaSierra LeoneSolomon IslandsSomaliaSouth AfricaSouth AsiaSouth Asia (IDA & IBRD)Sri LankaSt. LuciaSt. Vincent and the GrenadinesSub-Saharan Africa Sub-Saharan Africa (excluding high income)Sub-Saharan Africa (IDA & IBRD countries)SudanSwazilandSyrian Arab RepublicTajikistanTanzaniaThailandTogoTongaTunisiaTurkeyTurkmenistanUgandaUkraineUpper middle incomeUzbekistanVanuatuVenezuela, RBVietnamYemen, Rep.ZambiaZimbabwe

Linha do tempo:

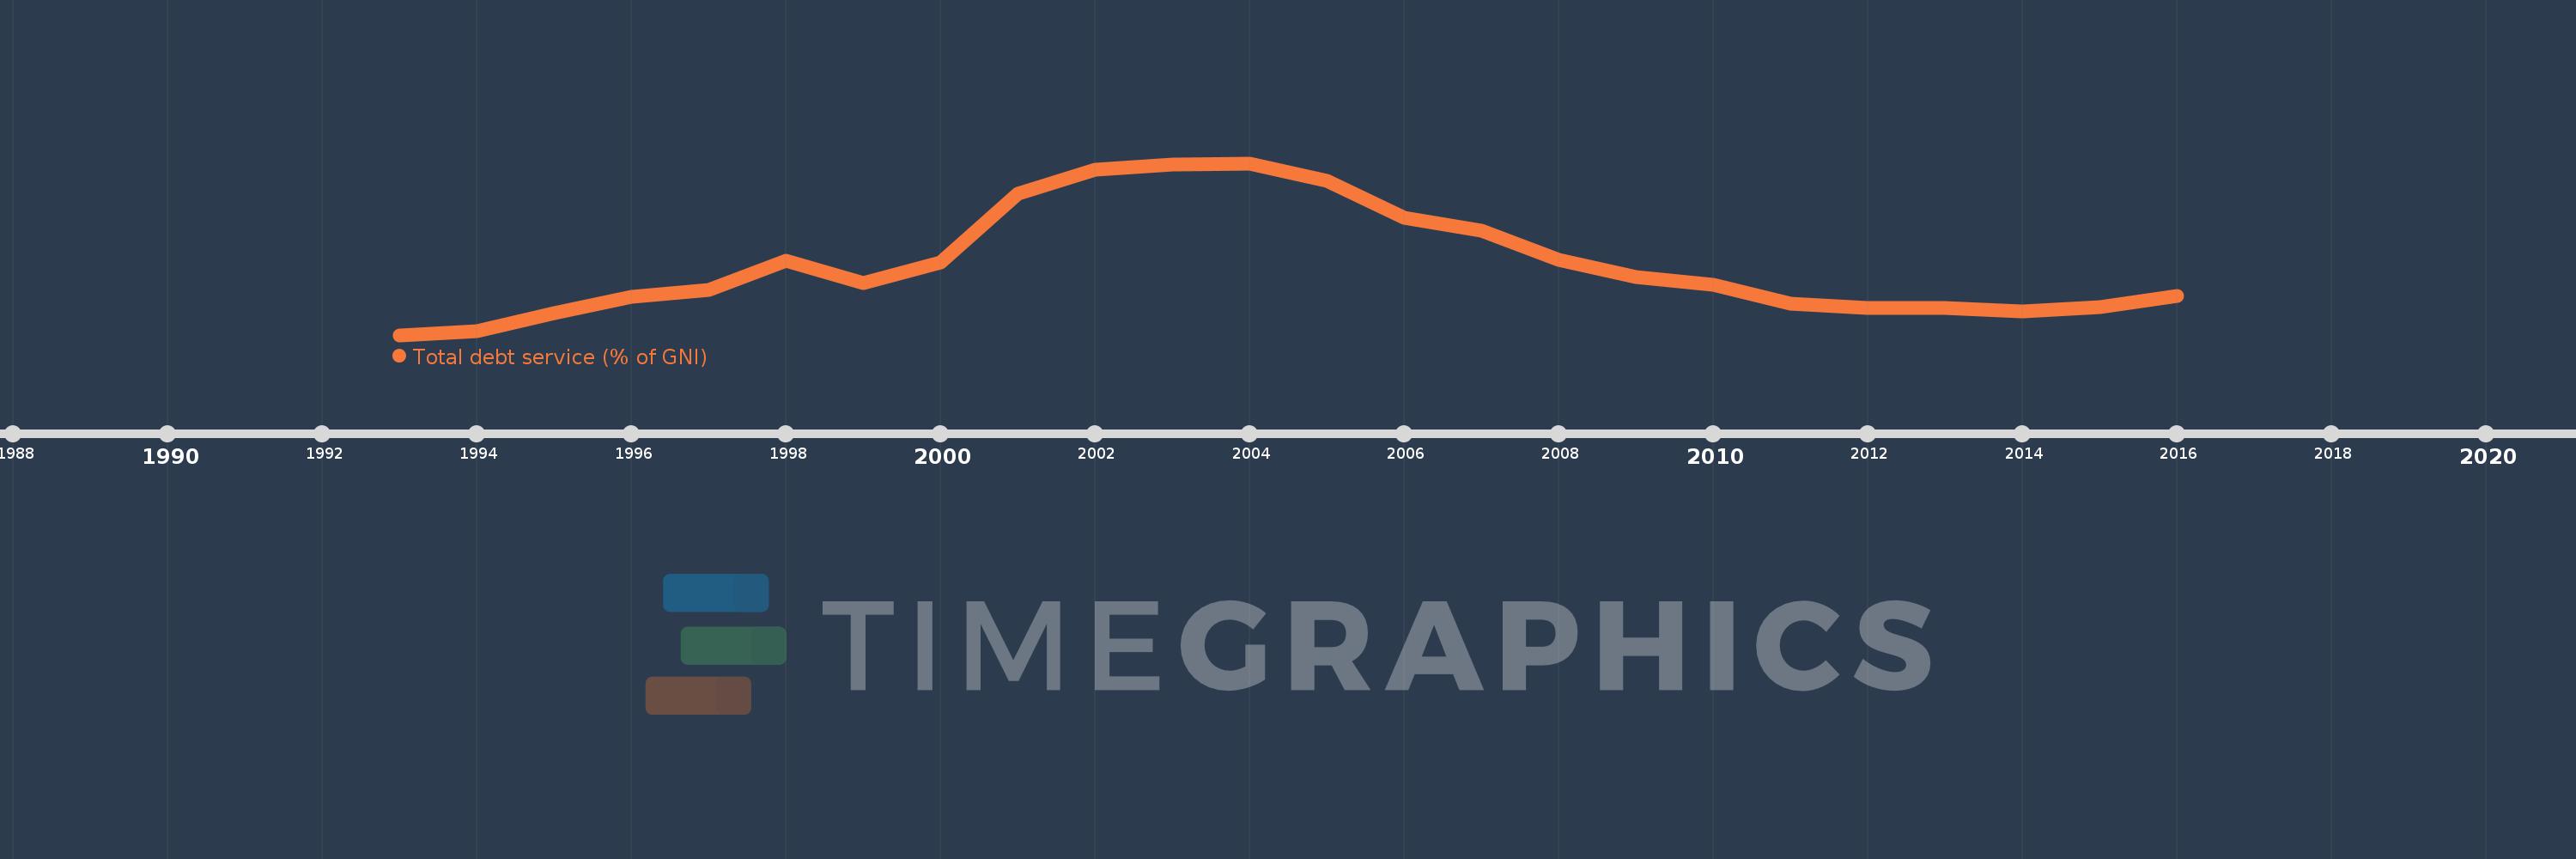
Nesta escala de tempo está apresentado um gráfico de 1993 ano até 2016 ano Uzbekistan. Dados de 1992 ano ausente. O número de observações reais por data: 24.

Fonte (nome):

Indicadores de desenvolvimento mundial

Fonte (organização):

World Bank, International Debt Statistics.

Categorias:

Economy & Growth, External Debt

Foi atualizado:

23 abr 2017 ano

Indicadores de alterações dos valores ao longo dos anos

Em média:
3.362
Mínimo:
0.036
1 jan 1993 ano
Máximo:
8.141
1 jan 2004 ano
Na data de observação
Valor
Mudança absoluta
A alteração em relação ao valor anterior
1 jan 1993 ano
0.036
+0.036
0.0%
1 jan 1994 ano
0.227
+0.191
523.99%
1 jan 1995 ano
1.074
+0.847
372.87%
1 jan 1996 ano
1.838
+0.764
71.12%
1 jan 1997 ano
2.178
+0.341
18.53%
1 jan 1998 ano
3.53
+1.352
62.08%
1 jan 1999 ano
2.472
-1.059
-29.98%
1 jan 2000 ano
3.454
+0.983
39.75%
1 jan 2001 ano
6.702
+3.247
94.01%
1 jan 2002 ano
7.83
+1.128
16.83%
1 jan 2003 ano
8.062
+0.233
2.97%
1 jan 2004 ano
8.141
+0.078
0.97%
1 jan 2005 ano
7.297
-0.844
-10.37%
1 jan 2006 ano
5.566
-1.73
-23.72%
1 jan 2007 ano
4.963
-0.603
-10.84%
1 jan 2008 ano
3.589
-1.374
-27.68%
1 jan 2009 ano
2.758
-0.831
-23.15%
1 jan 2010 ano
2.418
-0.34
-12.34%
1 jan 2011 ano
1.526
-0.891
-36.87%
1 jan 2012 ano
1.313
-0.213
-13.98%
1 jan 2013 ano
1.312
-0.001
-0.06%
1 jan 2014 ano
1.167
-0.145
-11.08%
1 jan 2015 ano
1.365
+0.199
17.02%
1 jan 2016 ano
1.868
+0.502
36.77%

Classificação de países por estatísticas atuais por anos