33
/pt/
AIzaSyB4mHJ5NPEv-XzF7P6NDYXjlkCWaeKw5bc
November 30, 2025
34666
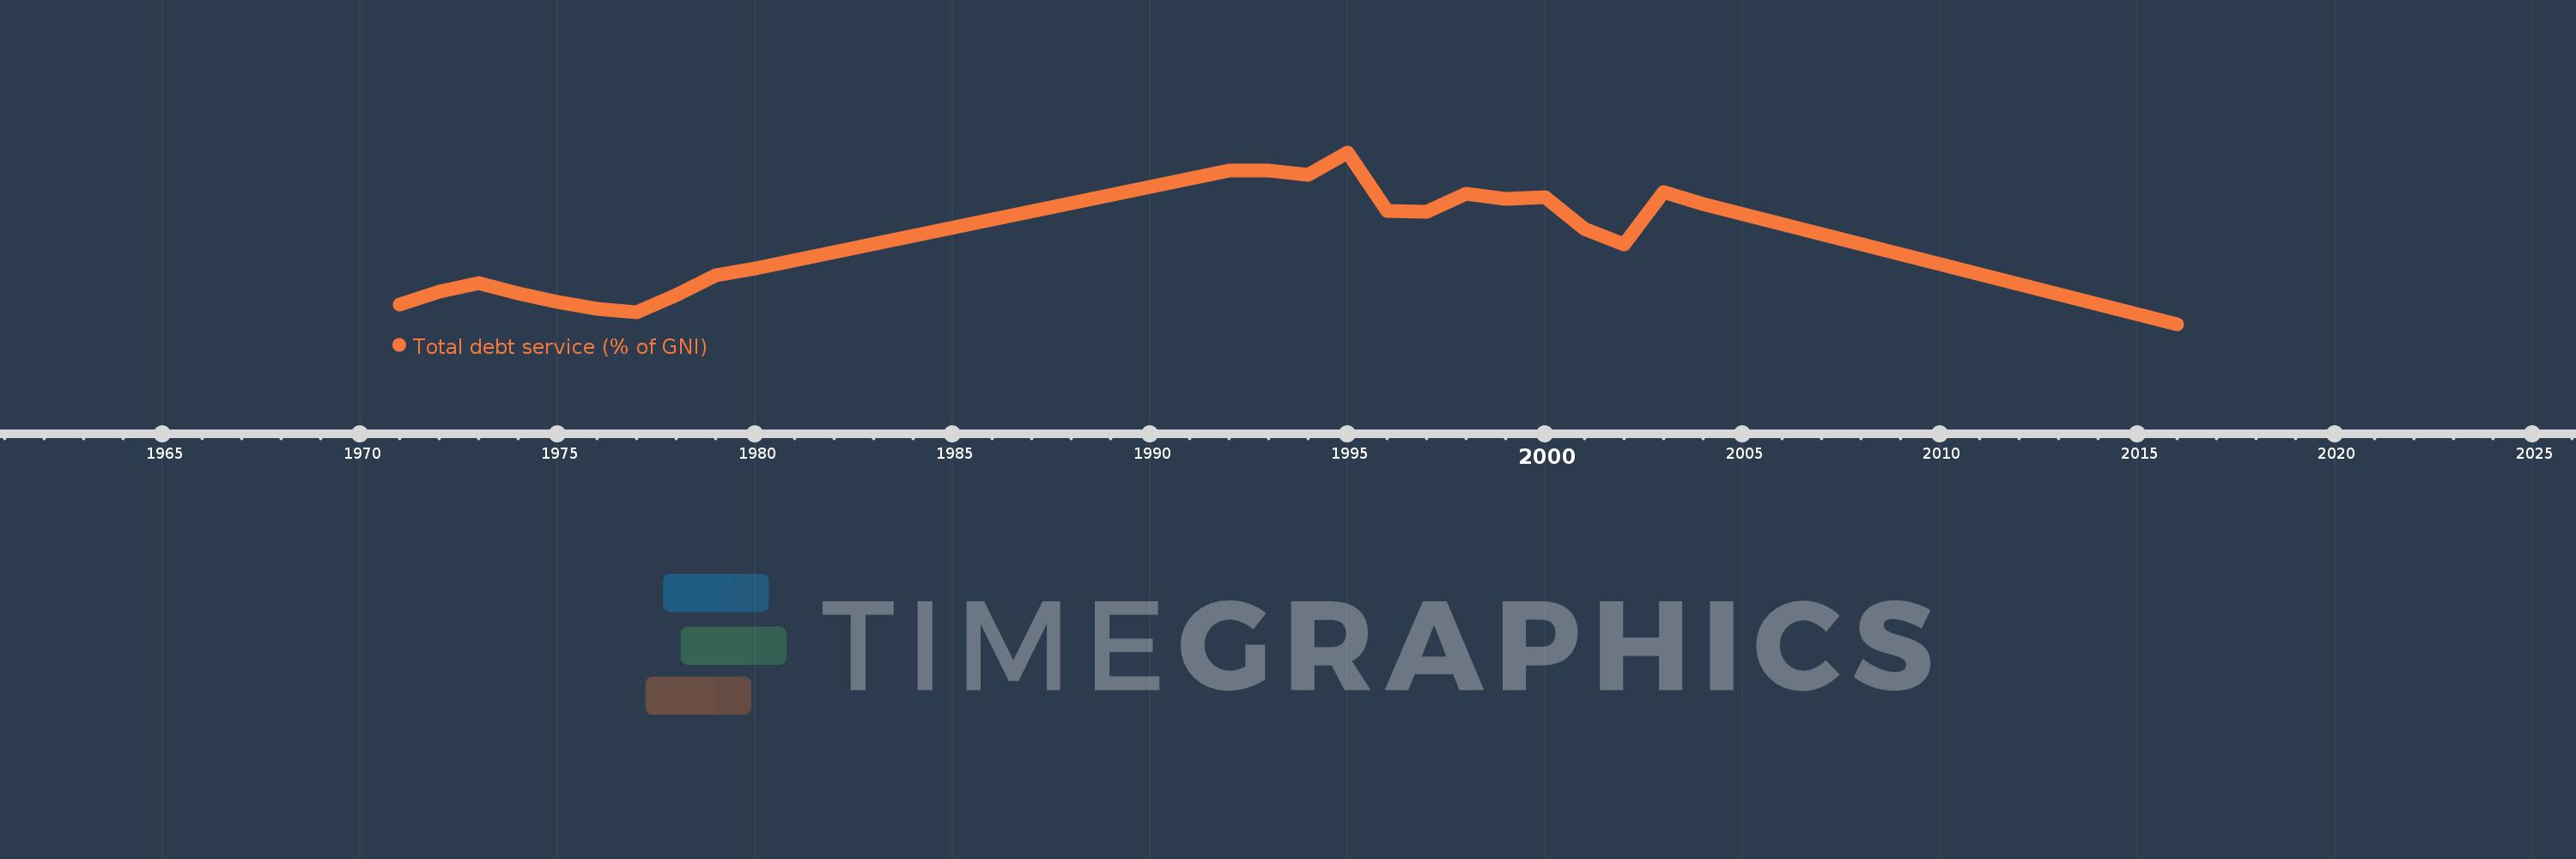
Fragile and conflict affected situations
FCS
false
2
1
Total debt service (% of GNI)
2016,2004,2003,2002,2001,2000,1999,1998,1997,1996,1995,1994,1993,1992,1980,1979,1978,1977,1976,1975,1974,1973,1972,1971