33
/pt/
AIzaSyB4mHJ5NPEv-XzF7P6NDYXjlkCWaeKw5bc
November 1, 2025
78710
Bangladesh
BGD
true
2
1
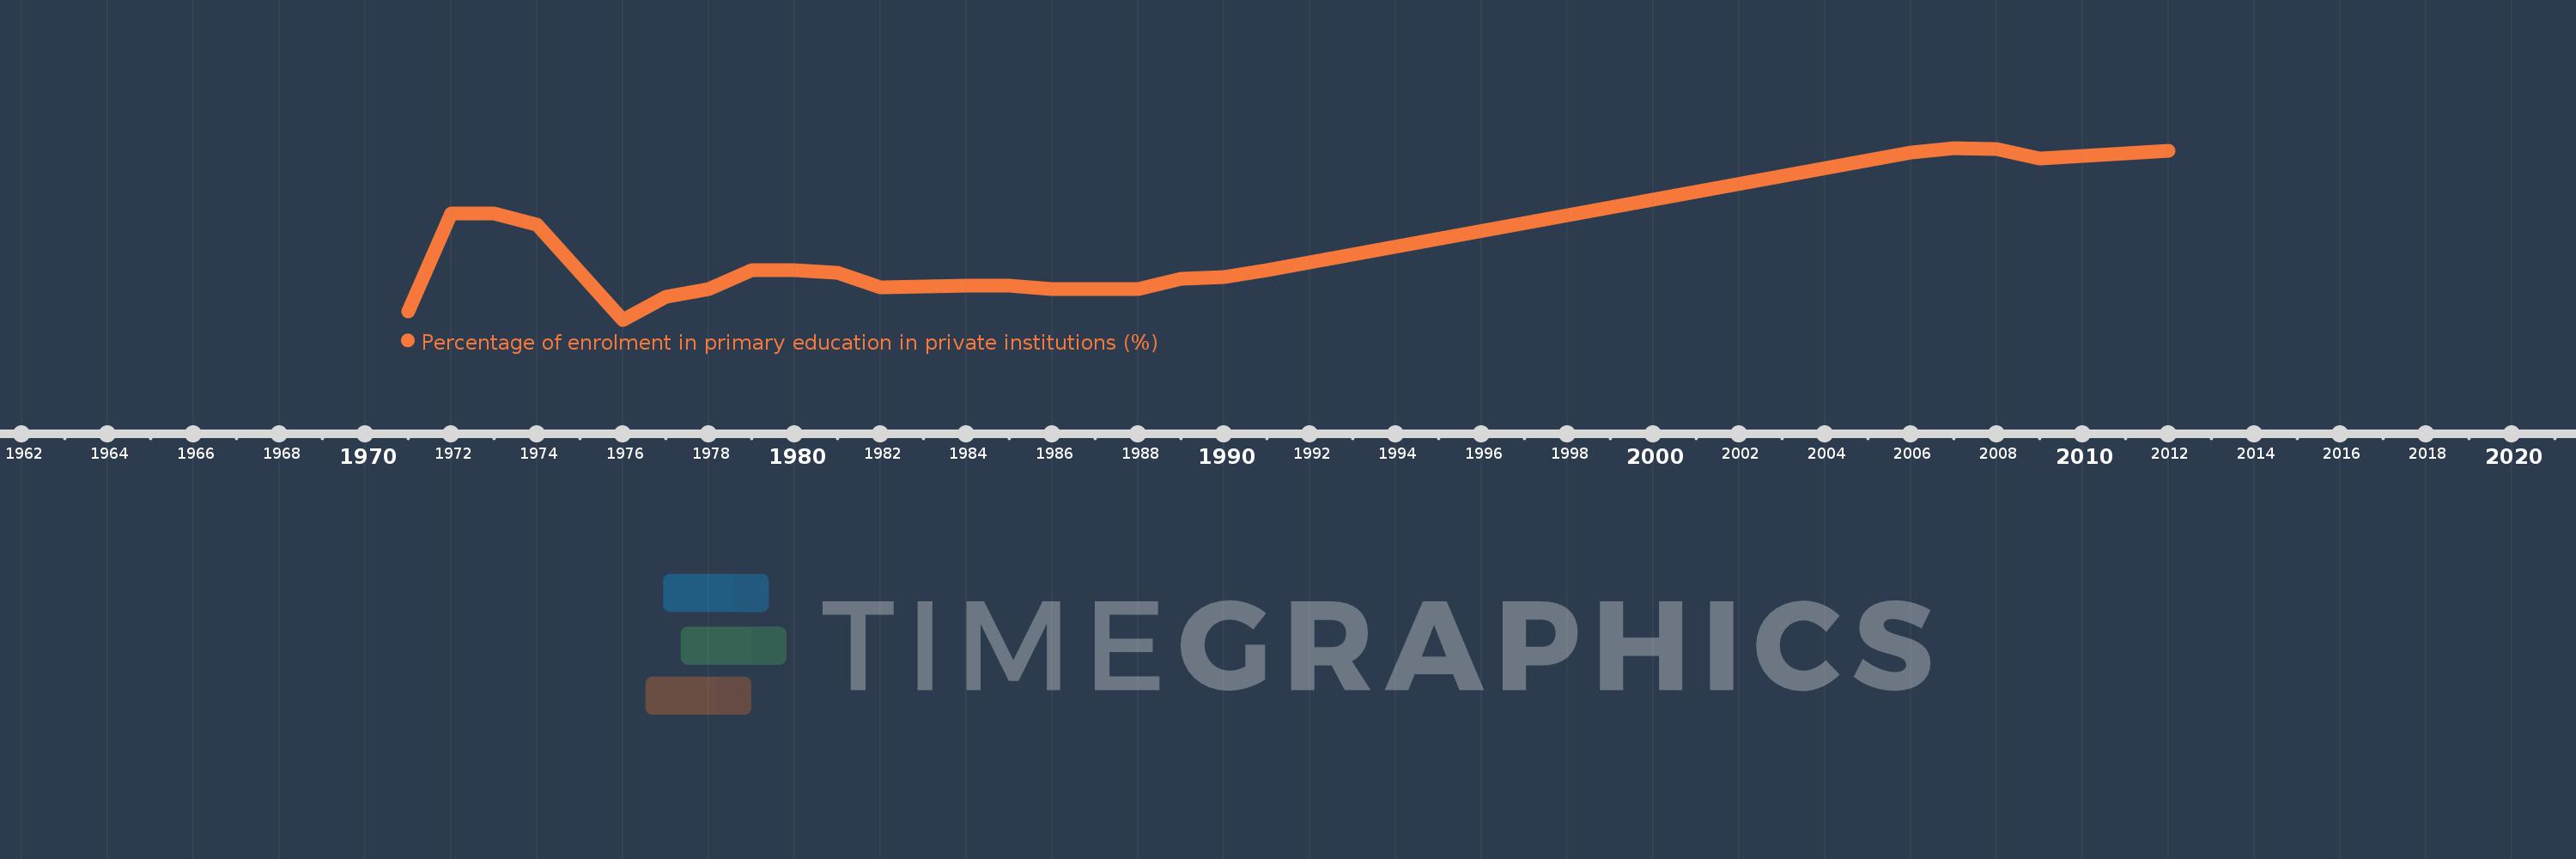
Percentage of enrolment in primary education in private institutions (%)
2012,2010,2009,2008,2007,2006,1991,1990,1989,1988,1987,1986,1985,1984,1982,1981,1980,1979,1978,1977,1976,1974,1973,1972,1971