33
/pt/
AIzaSyB4mHJ5NPEv-XzF7P6NDYXjlkCWaeKw5bc
November 1, 2025
157741
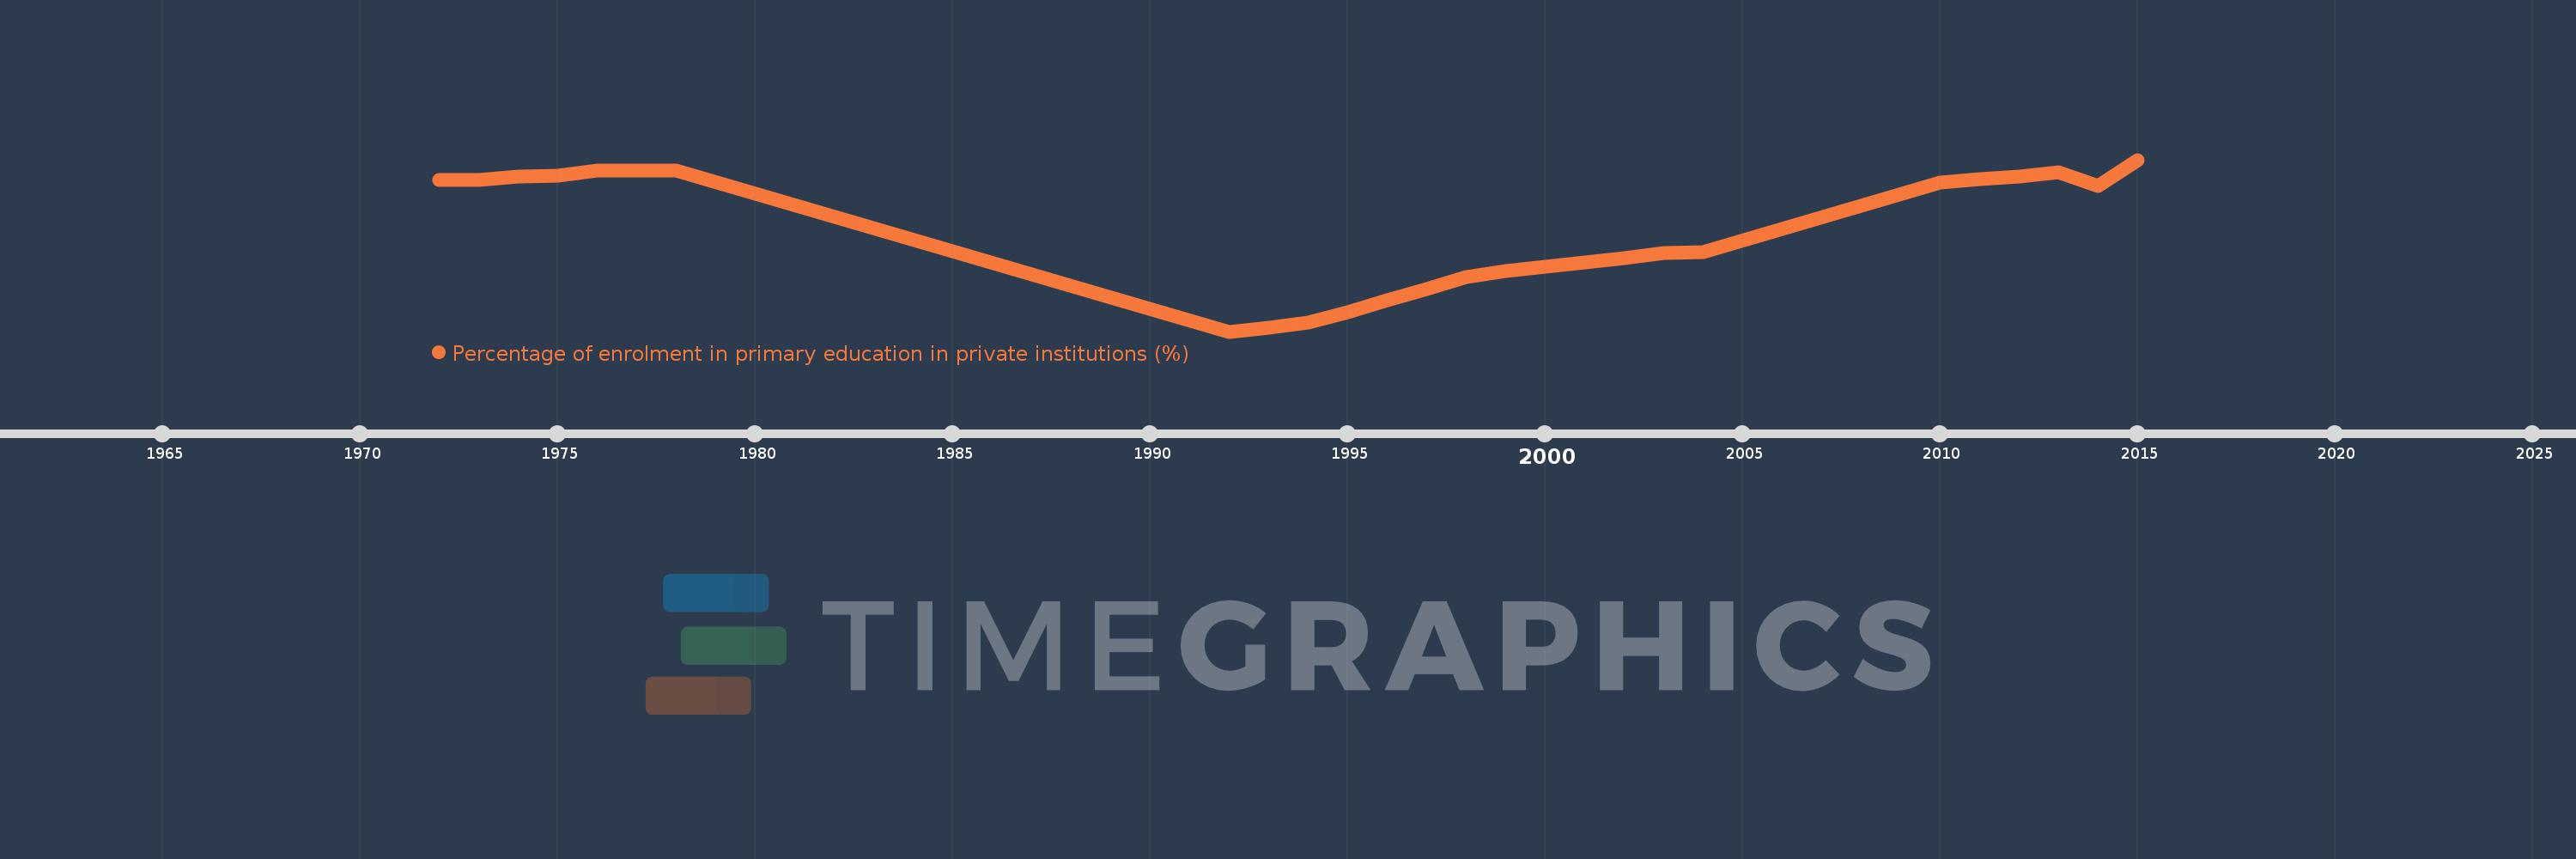
Iran, Islamic Rep.
IRN
true
2
1
Percentage of enrolment in primary education in private institutions (%)
2015,2014,2013,2012,2011,2010,2004,2003,2002,2001,1999,1998,1997,1996,1995,1994,1993,1992,1978,1977,1976,1975,1974,1973,1972