33
/pt/
AIzaSyB4mHJ5NPEv-XzF7P6NDYXjlkCWaeKw5bc
November 1, 2025
125270
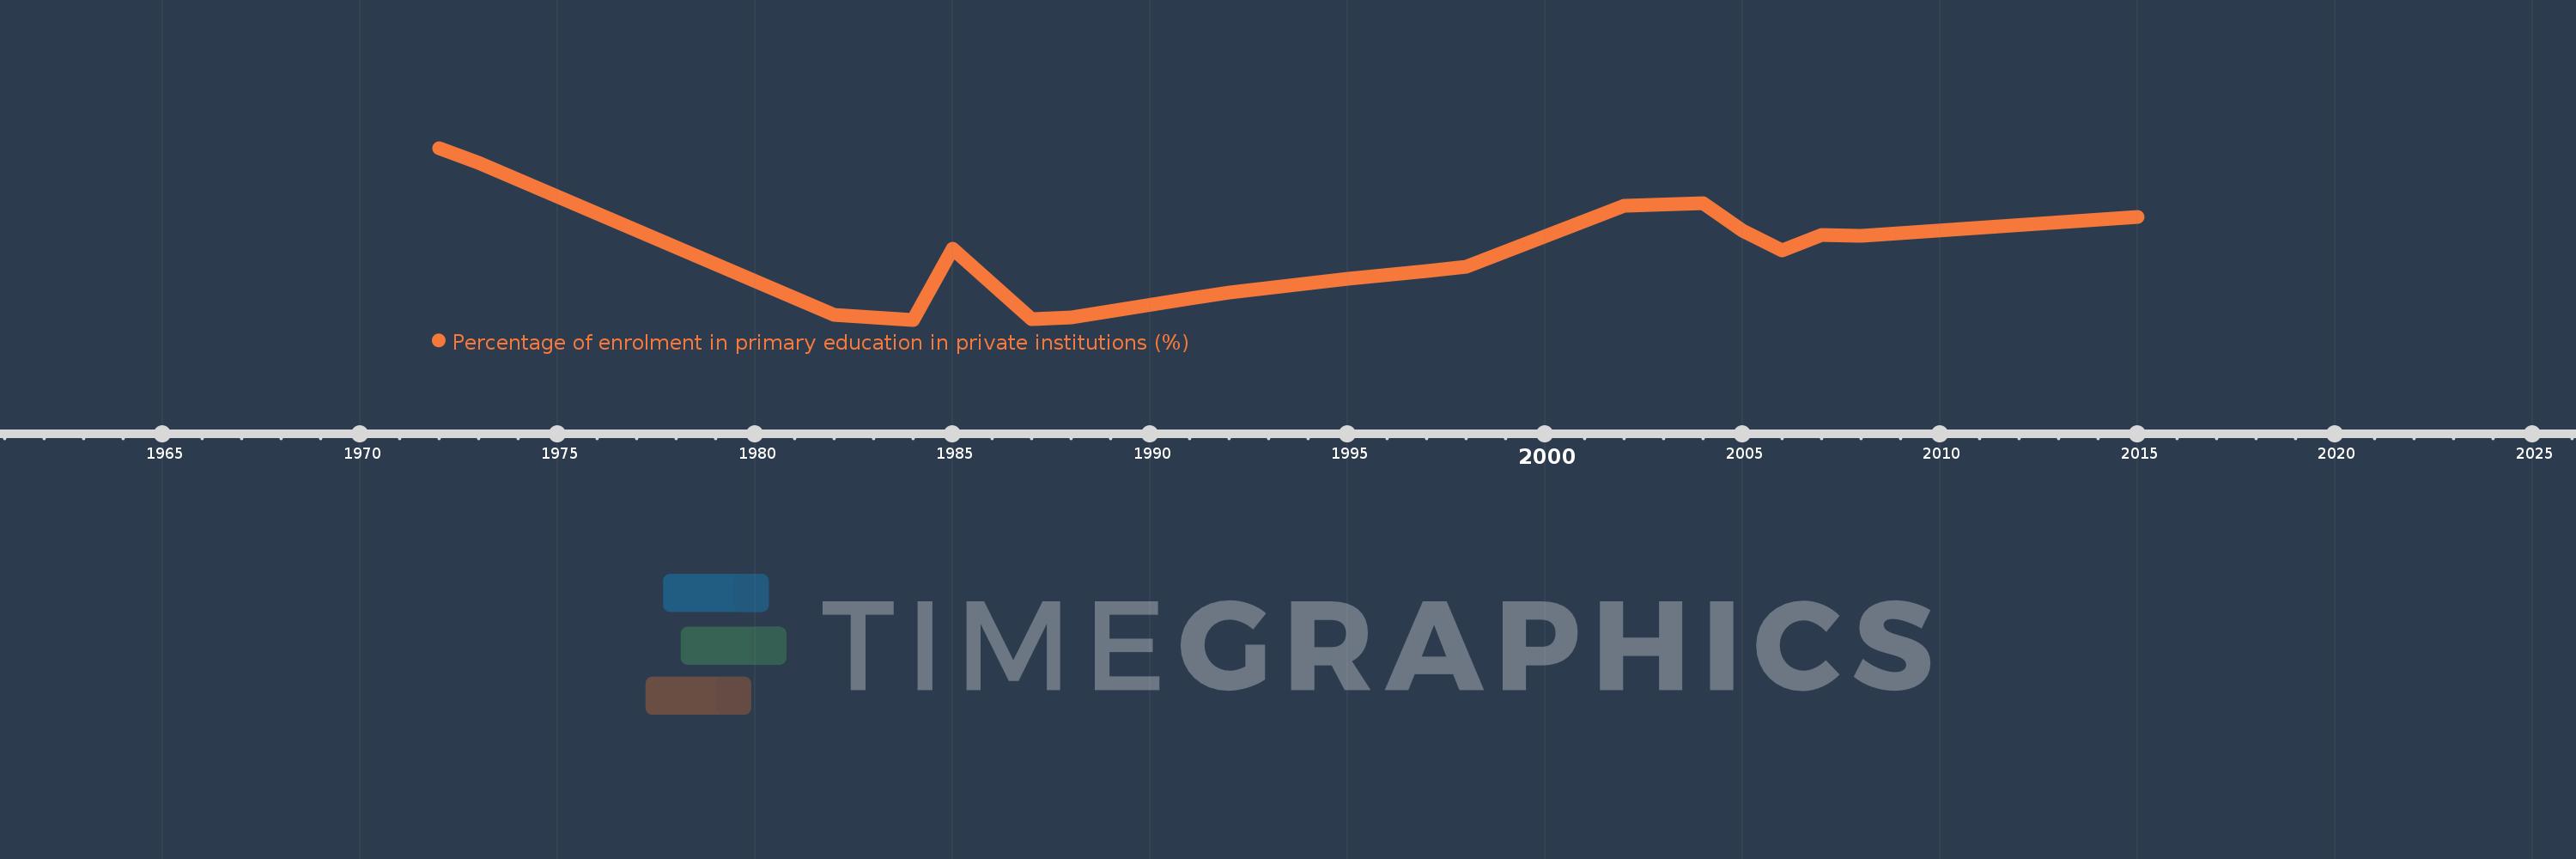
Egypt, Arab Rep.
EGY
true
2
1
Percentage of enrolment in primary education in private institutions (%)
2015,2008,2007,2006,2005,2004,2002,1998,1997,1995,1992,1991,1988,1987,1985,1984,1983,1982,1973,1972